Artificial Intelligence (Ai) in medical diagnostics Market Size Report, 2023-2032
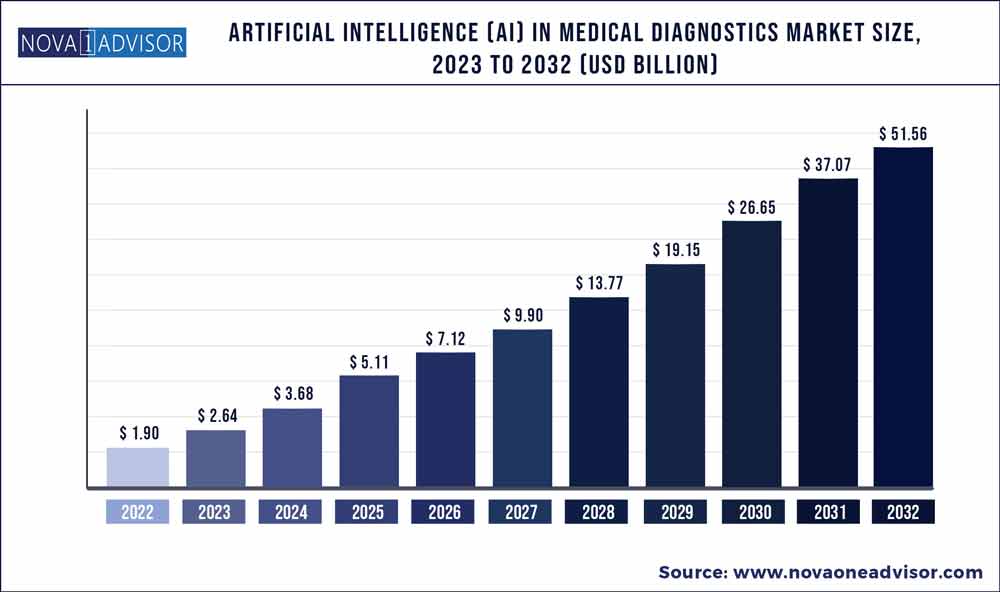
The global artificial Intelligence (Ai) in medical diagnostics market size was exhibited at USD 1.90 billion in 2022 and is projected to hit around USD 51.56 billion by 2032, growing at a CAGR of 39.11% during the forecast period 2023 to 2032.
Key Pointers:
Artificial Intelligence (Ai) in medical diagnostics Market Report Scope
| Report Coverage | Details |
| Market Size in 2023 | USD 2.64 Billion |
| Market Size by 2032 | USD 51.56 Billion |
| Growth Rate from 2023 to 2032 | CAGR of 39.11% |
| Base Year | 2022 |
| Forecast Period | 2023 to 2032 |
| Segments Covered | Component, Application, End User |
| Regions Covered | North America, Europe, APAC, MEA, and Latin America |
The application of AI in medical diagnostics is growing at a fast pace owing to factors such as rising government initiatives to drive the adoption of AI-based technologies, increasing adoption of AI solutions by radiologists to reduce work pressure, the influx of big data, availability of funding for AI-based startups, and the growing number of cross-industry partnerships & collaborations. However, the lack of a skilled AI workforce, ambiguity in regulations, and the reluctance among medical practitioners to adopt these solutions are factors expected to restrain the market growth.
AI In Medical Diagnostics Market Dynamics
Drivers: Influx of big data
With the increasing digitization and adoption of information systems in the healthcare industry, big data (large and complex data) is generated at various stages of the care delivery process. In the medical diagnostics industry, big data comprises information generated from clickstream and web & social media interactions; readings from medical devices, such as sensors, ECGs, X-rays, healthcare claims, and other billing records; and biometric data, among other sources. Big data and analytical solutions have grown exponentially in sophistication and adoption in the last decade with the growing adoption of EHRs, digitized laboratory slides, and high-resolution radiology images among healthcare providers. Healthcare is one of the top five big data industries, especially in the US. In the coming years, the volume of big data in medical diagnostics is expected to increase due to the use of bidirectional patient portals, which allow patients to upload data and images to their EMRs. The need to efficiently manage the ever-increasing volume of large and complex medical diagnostic data is compelling the healthcare industry to turn its focus toward various AI-based solutions
Restraints: Reluctance among medical practitioners to adopt AI-based technologies
Extensive growth in digital health has enabled healthcare providers to assist patients through novel treatment approaches. AI technologies offer doctors tools that help them diagnose and effectively treat patients better. However, there is an observed reluctance among doctors in the acceptance of new technologies. For instance, medical practitioners have a misconception that AI will replace doctors in the coming years. Doctors and radiologists believe that skills such as empathy and persuasion are human skills; thus, technologies cannot completely rule out the presence of a doctor. Additionally, there is a concern that patients may be excessively inclined toward these technologies and may forgo necessary in-person treatments, which might also challenge long-term doctor-patient relationships. Several healthcare professionals have doubts about AI capabilities in accurately diagnosing patient conditions. Therefore, it is challenging to convince providers that AI-based solutions are cost-effective, efficient, and safe solutions that offer doctors convenience and better patient care. However, healthcare providers are increasingly accepting the potential benefits of AI-based solutions and the spectrum of applications it serves. Hence, there is a possibility that in the coming years, doctors and radiologists will be more inclined toward AI-based technologies in healthcare.
Challenges: Budgetary constraints
Overcoming financial constraints is the biggest challenge for healthcare organizations, especially in emerging economies where it is always a struggle to secure budgets for IT over medical equipment. The high cost of imaging equipment and implementation & licensing costs of AI software are the major factors restraining market growth, specifically in countries where the reimbursement scenario is poor. For instance, most healthcare facilities in developing countries cannot afford AI solutions due to high installation and maintenance costs. This factor is limiting the adoption of new or technologically advanced systems. Also, implementation and subscription/licensing fees form a major financial burden on end users. Owing to these budget constraints, small healthcare facilities cannot afford these solutions. This, in turn, is expected to negatively impact the growth of AI in the medical diagnostics market.
Opportunities: Increasing focus on developing human-aware AI systems
The actual projections aimed during the emergence of AI technologies were to make them human-aware, i.e., developing models with the characteristics of human thinking. However, creating interactive and scalable machines remains a challenge for the developers of AI machines. Additionally, rise in human interference with AI techniques and interest to discover the machine learning process has introduced new research challenges, i.e., interpretation and presentation challenges such as issues with automating parts and intelligent control of crowdsourcing. Interpretation challenges include challenges AI machines have in understanding human input, such as knowledge and specific directives. Presentation challenges include issues related to delivering the AI system’s output and feedback mechanisms . Thus, developing human-aware AI systems remains the foremost opportunity for AI developers
“Software segment is expected to grow at the highest rate during the forecast period”
The worldwide AI In Medical Diagnostics Market is divided into software and services based on component. The services segment dominated the market in 2022, while the software segment is estimated to grow at a higher CAGR during the forecast period. Software solutions provide healthcare providers a competitive edge over others, despite the challenges of being short-staffed and facing increasing imaging scan volumes.
“In Vivo Diagnostic segment accounted for the largest share”
The AI In Medical Diagnostics Market is divided based on applications into in vivo and in vitro diagnostics. The in vivo diagnostics segment commanded the largest share of this market in 2022. The large share of this segment can be attributed to the growing adoption of AI solutions by medical and healthcare industry, as these solutions help reduce human errors and improve treatment efficacy.
“The Hospitals segment is expected to grow with the highest CAGR during the forecast period”
Based on end users, the AI In Medical Diagnostics Market is segmented into hospitals, diagnostic imaging centers, diagnostic laboratories, and other end users. The hospitals segment commanded the largest share of this market in 2022. The large share of this segment can be attributed to the rising number of diagnostic imaging treatments performed in hospitals or used as standard procedures, the rising inclination of hospitals toward the automation and digitization of radiology patient workflow, increasing adoption of minimally invasive procedures in hospitals and healthcare facilities to improve the quality of patient care and focus on patient centric care , and the rising adoption of advanced imaging modalities to improve workflow .
North America accounted for the largest share of the global Market.
In 2022, North America accounted for the largest market share. However, the Asia Pacific market is projected to register the highest CAGR of 42.9% during the forecast period. The high growth rate of the Asia Pacific market can primarily be attributed to the growth strategies adopted by key players in emerging markets, digitization of medical diagnostics infrastructure, rising geriatric population, rise in prevalence of cancer, and the implementation of favorable government initiatives.
Recent Developments:
Some of the prominent players in the Artificial Intelligence (Ai) in medical diagnostics Market include:
Segments Covered in the Report
This report forecasts revenue growth at global, regional, and country levels and provides an analysis of the latest industry trends in each of the sub-segments from 2018 to 2032. For this study, Nova one advisor, Inc. has segmented the global artificial Intelligence (Ai) in medical diagnostics market.
By Component
By Application
By End User
By Region
Chapter 1. Introduction
1.1. Research Objective
1.2. Scope of the Study
1.3. Definition
Chapter 2. Research Methodology
2.1. Research Approach
2.2. Data Sources
2.3. Assumptions & Limitations
Chapter 3. Executive Summary
3.1. Market Snapshot
Chapter 4. Market Variables and Scope
4.1. Introduction
4.2. Market Classification and Scope
4.3. Industry Value Chain Analysis
4.3.1. Raw Material Procurement Analysis
4.3.2. Sales and Distribution Channel Analysis
4.3.3. Downstream Buyer Analysis
Chapter 5. Market Dynamics Analysis and Trends
5.1. Market Dynamics
5.1.1. Market Drivers
5.1.2. Market Restraints
5.1.3. Market Opportunities
5.2. Porter’s Five Forces Analysis
5.2.1. Bargaining power of suppliers
5.2.2. Bargaining power of buyers
5.2.3. Threat of substitute
5.2.4. Threat of new entrants
5.2.5. Degree of competition
Chapter 6. Competitive Landscape
6.1.1. Company Market Share/Positioning Analysis
6.1.2. Key Strategies Adopted by Players
6.1.3. Vendor Landscape
6.1.3.1. List of Suppliers
6.1.3.2. List of Buyers
Chapter 7. Global Artificial Intelligence (Ai) In Medical Diagnostics Market, By Component
7.1. Artificial Intelligence (Ai) In Medical Diagnostics Market, By Component, 2022-2032
7.1.1. Software
7.1.1.1. Market Revenue and Forecast (2020-2032)
7.1.2. Services
7.1.2.1. Market Revenue and Forecast (2020-2032)
Chapter 8. Global Artificial Intelligence (Ai) In Medical Diagnostics Market, By Application
8.1. Artificial Intelligence (Ai) In Medical Diagnostics Market, By Application, 2022-2032
8.1.1. In Vivo Diagnostics
8.1.1.1. Market Revenue and Forecast (2020-2032)
8.1.2. In Vitro Diagnostics
8.1.2.1. Market Revenue and Forecast (2020-2032)
Chapter 9. Global Artificial Intelligence (Ai) In Medical Diagnostics Market, By End User
9.1. Artificial Intelligence (Ai) In Medical Diagnostics Market, by End User, 2022-2032
9.1.1. Hospitals
9.1.1.1. Market Revenue and Forecast (2020-2032)
9.1.2. Diagnostic Imaging Centers
9.1.2.1. Market Revenue and Forecast (2020-2032)
9.1.3. Diagnostic Imaging Centers
9.1.3.1. Market Revenue and Forecast (2020-2032)
9.1.4. Others
9.1.4.1. Market Revenue and Forecast (2020-2032)
Chapter 10.Global Artificial Intelligence (Ai) In Medical Diagnostics Market, Regional Estimates and Trend Forecast
10.1. North America
10.1.1. Market Revenue and Forecast, By Component (2020-2032)
10.1.2. Market Revenue and Forecast, By Application (2020-2032)
10.1.3. Market Revenue and Forecast, by End User (2020-2032)
10.1.4. U.S.
10.1.4.1. Market Revenue and Forecast, By Component (2020-2032)
10.1.4.2. Market Revenue and Forecast, By Application (2020-2032)
10.1.4.3. Market Revenue and Forecast, by End User (2020-2032)
10.1.5. Rest of North America
10.1.5.1. Market Revenue and Forecast, By Component (2020-2032)
10.1.5.2. Market Revenue and Forecast, By Application (2020-2032)
10.1.5.3. Market Revenue and Forecast, by End User (2020-2032)
10.2. Europe
10.2.1. Market Revenue and Forecast, By Component (2020-2032)
10.2.2. Market Revenue and Forecast, By Application (2020-2032)
10.2.3. Market Revenue and Forecast, by End User (2020-2032)
10.2.4. UK
10.2.4.1. Market Revenue and Forecast, By Component (2020-2032)
10.2.4.2. Market Revenue and Forecast, By Application (2020-2032)
10.2.4.3. Market Revenue and Forecast, by End User (2020-2032)
10.2.5. Germany
10.2.5.1. Market Revenue and Forecast, By Component (2020-2032)
10.2.5.2. Market Revenue and Forecast, By Application (2020-2032)
10.2.5.3. Market Revenue and Forecast, by End User (2020-2032)
10.2.6. France
10.2.6.1. Market Revenue and Forecast, By Component (2020-2032)
10.2.6.2. Market Revenue and Forecast, By Application (2020-2032)
10.2.6.3. Market Revenue and Forecast, by End User (2020-2032)
10.2.7. Rest of Europe
10.2.7.1. Market Revenue and Forecast, By Component (2020-2032)
10.2.7.2. Market Revenue and Forecast, By Application (2020-2032)
10.2.7.3. Market Revenue and Forecast, by End User (2020-2032)
10.3. APAC
10.3.1. Market Revenue and Forecast, By Component (2020-2032)
10.3.2. Market Revenue and Forecast, By Application (2020-2032)
10.3.3. Market Revenue and Forecast, by End User (2020-2032)
10.3.4. India
10.3.4.1. Market Revenue and Forecast, By Component (2020-2032)
10.3.4.2. Market Revenue and Forecast, By Application (2020-2032)
10.3.4.3. Market Revenue and Forecast, by End User (2020-2032)
10.3.5. China
10.3.5.1. Market Revenue and Forecast, By Component (2020-2032)
10.3.5.2. Market Revenue and Forecast, By Application (2020-2032)
10.3.5.3. Market Revenue and Forecast, by End User (2020-2032)
10.3.6. Japan
10.3.6.1. Market Revenue and Forecast, By Component (2020-2032)
10.3.6.2. Market Revenue and Forecast, By Application (2020-2032)
10.3.6.3. Market Revenue and Forecast, by End User (2020-2032)
10.3.7. Rest of APAC
10.3.7.1. Market Revenue and Forecast, By Component (2020-2032)
10.3.7.2. Market Revenue and Forecast, By Application (2020-2032)
10.3.7.3. Market Revenue and Forecast, by End User (2020-2032)
10.4. MEA
10.4.1. Market Revenue and Forecast, By Component (2020-2032)
10.4.2. Market Revenue and Forecast, By Application (2020-2032)
10.4.3. Market Revenue and Forecast, by End User (2020-2032)
10.4.4. GCC
10.4.4.1. Market Revenue and Forecast, By Component (2020-2032)
10.4.4.2. Market Revenue and Forecast, By Application (2020-2032)
10.4.4.3. Market Revenue and Forecast, by End User (2020-2032)
10.4.5. North Africa
10.4.5.1. Market Revenue and Forecast, By Component (2020-2032)
10.4.5.2. Market Revenue and Forecast, By Application (2020-2032)
10.4.5.3. Market Revenue and Forecast, by End User (2020-2032)
10.4.6. South Africa
10.4.6.1. Market Revenue and Forecast, By Component (2020-2032)
10.4.6.2. Market Revenue and Forecast, By Application (2020-2032)
10.4.6.3. Market Revenue and Forecast, by End User (2020-2032)
10.4.7. Rest of MEA
10.4.7.1. Market Revenue and Forecast, By Component (2020-2032)
10.4.7.2. Market Revenue and Forecast, By Application (2020-2032)
10.4.7.3. Market Revenue and Forecast, by End User (2020-2032)
10.5. Latin America
10.5.1. Market Revenue and Forecast, By Component (2020-2032)
10.5.2. Market Revenue and Forecast, By Application (2020-2032)
10.5.3. Market Revenue and Forecast, by End User (2020-2032)
10.5.4. Brazil
10.5.4.1. Market Revenue and Forecast, By Component (2020-2032)
10.5.4.2. Market Revenue and Forecast, By Application (2020-2032)
10.5.4.3. Market Revenue and Forecast, by End User (2020-2032)
10.5.5. Rest of LATAM
10.5.5.1. Market Revenue and Forecast, By Component (2020-2032)
10.5.5.2. Market Revenue and Forecast, By Application (2020-2032)
10.5.5.3. Market Revenue and Forecast, by End User (2020-2032)
Chapter 11. Company Profiles
11.1. Microsoft Corporation
11.1.1. Company Overview
11.1.2. Product Offerings
11.1.3. Financial Performance
11.1.4. Recent Initiatives
11.2. NVIDIA
11.2.1. Company Overview
11.2.2. Product Offerings
11.2.3. Financial Performance
11.2.4. Recent Initiatives
11.3. IBM
11.3.1. Company Overview
11.3.2. Product Offerings
11.3.3. Financial Performance
11.3.4. Recent Initiatives
11.4. Intel
11.4.1. Company Overview
11.4.2. Product Offerings
11.4.3. Financial Performance
11.4.4. Recent Initiatives
11.5. Siemens Healthineers
11.5.1. Company Overview
11.5.2. Product Offerings
11.5.3. Financial Performance
11.5.4. Recent Initiatives
11.6. GE Healthcare
11.6.1. Company Overview
11.6.2. Product Offerings
11.6.3. Financial Performance
11.6.4. Recent Initiatives
11.7. Digital Diagnostics
11.7.1. Company Overview
11.7.2. Product Offerings
11.7.3. Financial Performance
11.7.4. Recent Initiatives
11.8. Xilinx
11.8.1. Company Overview
11.8.2. Product Offerings
11.8.3. Financial Performance
11.8.4. Recent Initiatives
11.9. InformAI
11.9.1. Company Overview
11.9.2. Product Offerings
11.9.3. Financial Performance
11.9.4. Recent Initiatives
11.10. Enlitic
11.10.1. Company Overview
11.10.2. Product Offerings
11.10.3. Financial Performance
11.10.4. Recent Initiatives
Chapter 12. Research Methodology
12.1. Primary Research
12.2. Secondary Research
12.3. Assumptions
Chapter 13. Appendix
13.1. About Us
13.2. Glossary of Terms