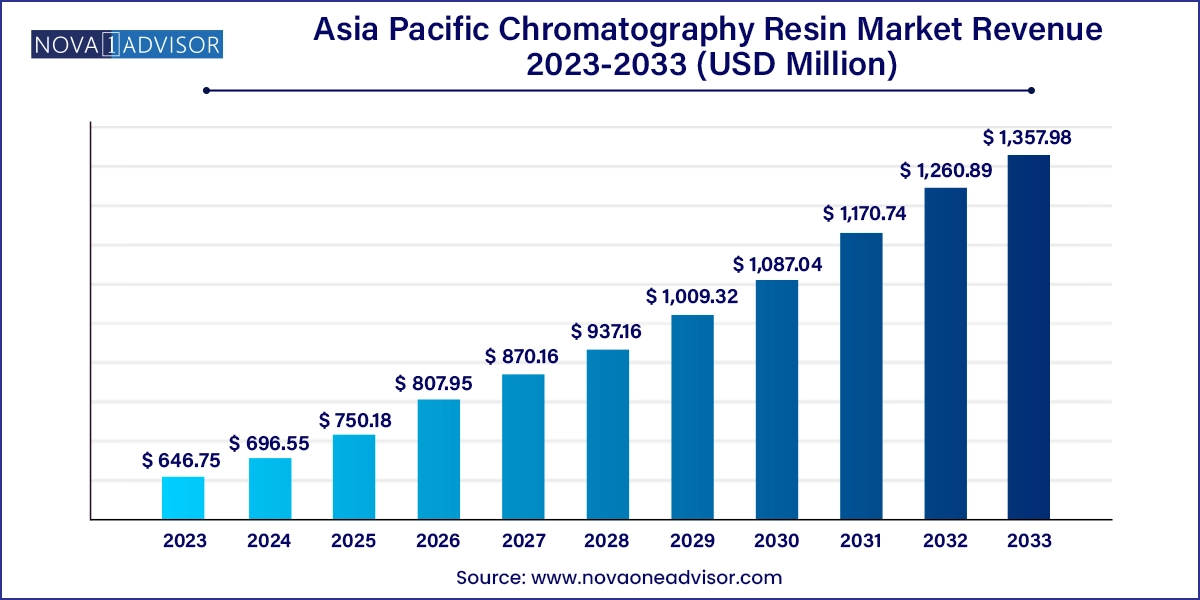
The Asia Pacific chromatography resin market size was exhibited at USD 646.75 million in 2023 and is projected to hit around USD 1,357.98 million by 2033, growing at a CAGR of 7.7% during the forecast period 2024 to 2033.

The Asia Pacific chromatography resin market is rapidly evolving as the region becomes a critical hub for pharmaceutical manufacturing, biotechnology innovation, and high-end food processing. Chromatography resins are pivotal materials used in separation techniques to purify proteins, nucleic acids, enzymes, and other biomolecules across a spectrum of applications. In the context of growing biologics demand, rising food quality regulations, and expanding scientific research infrastructure, the adoption of chromatography resins in Asia Pacific is on an accelerated growth path.
Chromatography resins function as the stationary phase in a chromatographic column and are essential in techniques like ion exchange, affinity, hydrophobic interaction, and size exclusion chromatography. These resins enable the separation of complex mixtures into their individual components, ensuring the purity, safety, and quality of products particularly critical in biologics and vaccines manufacturing. Asia Pacific, especially countries like China, India, and Japan, has emerged as a leading market due to the rapid expansion of biopharmaceutical industries, clinical research outsourcing, and increasing investments in healthcare infrastructure.
With regulatory agencies tightening standards for drug safety and traceability, the need for high-performance chromatographic purification techniques is increasing. At the same time, the region is witnessing a wave of localization in resin production, with several global players establishing R&D and manufacturing footprints in Asia to meet localized demand more efficiently. This is particularly important as biologics such as monoclonal antibodies, recombinant proteins, and gene therapies gain traction in Asia’s healthcare market.
Government support for biosimilars, generics, and pandemic preparedness is driving investments in bioseparation technologies, including chromatography. For example, national policies in China and India now explicitly promote the development of advanced therapeutic platforms, creating strong tailwinds for chromatography resins. Meanwhile, increased food safety incidents have led to the stricter enforcement of quality control protocols in food and beverage manufacturing, expanding chromatography’s utility beyond biopharma.
Biopharmaceutical Boom in Asia: Increased biologics production, including monoclonal antibodies, vaccines, and cell & gene therapies, is driving chromatography resin demand in manufacturing and quality control processes.
Rise of Local Resin Manufacturing Facilities: To reduce dependence on imports and strengthen supply chains, companies are establishing local chromatography resin production units in India and China.
Technological Shifts in Resin Engineering: Advancements such as mixed-mode chromatography and high-throughput resins are entering the market, offering better separation efficiency and reduced processing times.
Outsourcing of Chromatographic Services: With the surge in Contract Research and Manufacturing Organizations (CROs and CMOs) across Asia, chromatography resin consumption is growing in outsourced bio-manufacturing setups.
Eco-friendly and Recyclable Resin Development: As environmental compliance becomes more rigorous, manufacturers are exploring resins that can be regenerated and reused, minimizing chemical waste and environmental impact.
Strategic Collaborations with Academia: Companies are collaborating with top research universities across South Korea, Japan, and Singapore to develop next-generation chromatography materials.
Miniaturization and Microfluidics: Emerging trends in lab-on-chip chromatography systems using micro-resin particles are finding adoption in fast diagnostics and portable testing kits.
| Report Coverage | Details |
| Market Size in 2024 | USD 696.55 Million |
| Market Size by 2033 | USD 1,357.98 Million |
| Growth Rate From 2024 to 2033 | CAGR of 7.7% |
| Base Year | 2023 |
| Forecast Period | 2024-2033 |
| Segments Covered | Type, End-use, Technique, Country |
| Market Analysis (Terms Used) | Value (US$ Million/Billion) or (Volume/Units) |
| Key Companies Profiled | Mitsubishi Chemical Corp.; Tosoh Corp.; Sunresin New Materials Co., Ltd.; KANEKA Corp.; Qingdao Shenghan Chromatograph Technology Co., Ltd.; Shimadzu Corp.; Daicel Corp.; Anhui Wanyi Science & Technology Co., Ltd.; Drawell Instrument Co., Ltd. |
A key driver of the Asia Pacific chromatography resin market is the expansion of biopharmaceutical manufacturing facilities across the region. As global pharma companies shift a significant portion of their biologics production to Asia, local companies are also ramping up capabilities in biosimilars and vaccine development. Chromatography resins are central to purification processes in biologic drug manufacturing, ensuring precise separation of therapeutic proteins from host cell proteins and other impurities.
In India, the government's “Pharma Vision 2020” and “Make in India” initiatives have incentivized companies to invest in biotech parks and set up sophisticated purification lines. Similarly, China’s “Healthy China 2030” strategy has prioritized the development of biologics infrastructure, resulting in the expansion of biopharma parks in Suzhou and Beijing. These projects require advanced chromatography platforms and specialized resins that can deliver high yields with regulatory-grade purity. The sheer scale and pace of growth in biologics are translating into rising procurement of both synthetic and affinity-based chromatography resins.
One of the prominent restraints in the chromatography resin market is the high cost and technical complexity associated with advanced chromatography processes. Resins, particularly affinity and mixed-mode types used in protein purification, are expensive and require precise operational parameters for optimal performance. The cost burden increases when considering the need for frequent resin replacement, stringent cleaning validation, and temperature/humidity-controlled storage conditions.
Furthermore, in many developing parts of Asia, the lack of trained chromatography professionals and insufficient infrastructure for GMP-compliant processes limits the uptake of high-end resins. Smaller biopharmaceutical firms and diagnostic labs often opt for basic, low-cost purification techniques that compromise yield and purity. The upskilling required to fully utilize chromatography resins, along with the expense of resins from global suppliers, poses a challenge to market penetration, especially among SMEs and academic labs with tight budgets.
A significant opportunity lies in the localization of chromatography resin production across Asia Pacific, particularly in India and China. To reduce import dependence and mitigate supply chain disruptions experienced during the COVID-19 pandemic, regional players are establishing in-house resin manufacturing capabilities. This trend is supported by favorable government policies, subsidies, and tax incentives for high-tech manufacturing.
For instance, in September 2024, Purolite a global leader in chromatography resin announced the opening of a new Asia Pacific Center of Excellence in Bioprocessing and Chromatography in Singapore, designed to support regional formulation and technical innovation. Similarly, Indian pharmaceutical and chemical conglomerates have entered joint ventures with global resin providers to co-develop cost-effective, locally manufactured chromatography solutions. These regional hubs not only reduce lead times and costs but also enable product customization for local therapeutic portfolios, ranging from recombinant vaccines to herbal extracts. Localization thus emerges as a pivotal enabler of market expansion.
Ion exchange chromatography dominated the technique segment, owing to its versatility, cost-efficiency, and widespread use in protein, nucleic acid, and antibody purification. The method is integral to biologics manufacturing pipelines and is routinely employed in India and China for insulin and recombinant protein purification. It is particularly suited for large-scale continuous processing, offering high throughput with excellent recovery rates. The simplicity and robustness of ion exchange techniques make it a default option across both research institutions and commercial production plants in the region.
On the other hand, affinity chromatography is the fastest-growing technique, propelled by the boom in monoclonal antibody and gene therapy production. The technique provides unparalleled specificity, often yielding purities of over 99%, making it indispensable in downstream bioprocessing. With Japan’s expanding stem cell and regenerative medicine industries and South Korea’s growing biosimilar exports, affinity resins particularly protein A and protein G-based variants are in increasing demand. Advanced affinity resins are also gaining popularity in academic labs where precision is critical for molecular biology experiments.
Synthetic resins dominated the chromatography resin type segment, owing to their superior chemical stability, consistent performance under harsh conditions, and wide applicability across biopharmaceutical and food processing industries. Synthetic polymer-based resins such as polystyrene-divinylbenzene and polyacrylamide are ideal for high-pressure chromatography systems used in protein purification. These resins allow for fine-tuned pore sizes and surface modifications, which is essential for achieving higher resolution separations in monoclonal antibody and insulin purification workflows. As Asia’s biologics production scales up, the demand for robust synthetic resins is only expected to intensify, especially in China and India where manufacturing hubs are rapidly evolving.
Meanwhile, inorganic media emerged as the fastest-growing resin type, particularly in niche applications involving metal affinity chromatography and specialized catalysis. Inorganic chromatography materials like silica gels, hydroxyapatite, and aluminum oxide are widely adopted in analytical laboratories and industrial separations where thermal resistance and mechanical strength are required. Japan and South Korea are at the forefront of research in inorganic chromatography media, often using them in conjunction with novel hybrid methods. The trend is also fueled by the growing importance of high-performance liquid chromatography (HPLC) and advanced diagnostics that require high-purity resin backbones.
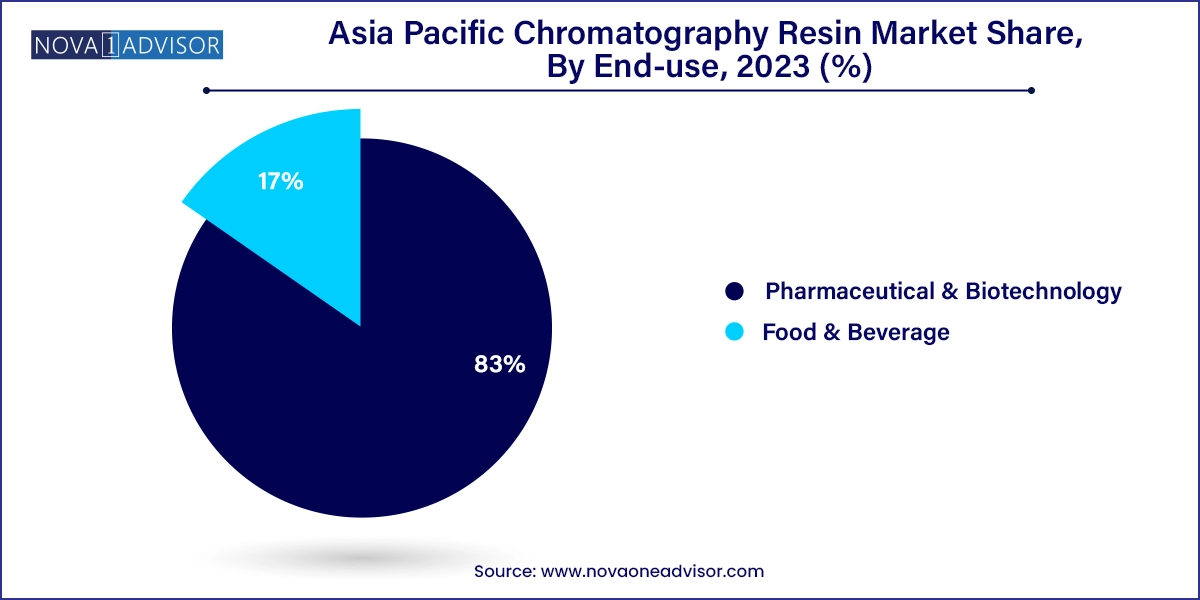
Pharmaceutical & biotechnology emerged as the dominant end-use segment, driven by the sheer volume of applications across drug discovery, diagnostics, process development, and API purification. Chromatography resins are indispensable in quality control, viral vector purification, and clinical sample analysis. With rising government funding for vaccine development in countries like India and collaborative research between global pharma and Japanese bio-startups, chromatography resin consumption has surged. Biotech startups in Hyderabad, Suzhou, and Osaka are leveraging innovative purification methods to accelerate clinical timelines, and chromatography plays a foundational role in these efforts.

At the same time, the food and beverage industry is witnessing the fastest growth in resin adoption, particularly in the removal of sugars, colorants, and other impurities in juice and flavor processing. Asia Pacific’s vast processed food market is seeing increasing regulatory focus on quality, especially following high-profile contamination incidents in China and South Korea. Companies are using chromatography resins to standardize taste, prolong shelf life, and meet international export standards. Japan's premium food and beverage segment is also incorporating chromatography in quality enhancement of sake and protein beverages, further bolstering resin demand.
China stands as the largest chromatography resin market in Asia Pacific, owing to its well-funded biopharmaceutical sector, increasing food safety scrutiny, and a growing ecosystem of academic and contract research organizations. The Chinese government is investing heavily in biologics and biopharma clusters, such as in Suzhou Industrial Park and Shanghai Biotech Valley, which rely extensively on chromatography platforms. Chinese resin manufacturers, including local players and joint ventures with global firms, are also gaining technological capabilities to meet internal demand for cost-effective purification solutions.
India is witnessing robust growth in chromatography resin consumption, largely driven by its leadership in generic pharmaceuticals and biosimilars. The Serum Institute of India, Bharat Biotech, and Biocon are major consumers of chromatography materials for vaccine and biosimilar manufacturing. The country’s emerging CRO industry and increasing funding in academic research are creating fertile ground for chromatography expansion. The government's Production Linked Incentive (PLI) schemes are also fostering domestic manufacturing of bioseparation materials, including chromatography resins.
Japan represents a high-tech chromatography resin market, characterized by sophisticated applications in personalized medicine, diagnostics, and regenerative therapies. Japanese firms such as Fujifilm Diosynth Biotechnologies and Takeda are global innovators in advanced therapeutics, where chromatography is critical in ensuring quality and safety. Additionally, Japan is home to many chromatography system developers who collaborate with resin manufacturers to produce high-efficiency, hybrid resin systems. The nation’s strict regulatory oversight also necessitates high-purity resins, stimulating consistent demand.
South Korea has emerged as a key player in biopharmaceutical and research-driven chromatography usage, with global companies like Samsung Biologics and Celltrion investing in large-scale purification lines. Government policies encouraging biotech innovation and export competitiveness have led to advanced bioprocessing infrastructure, where chromatography is indispensable. Universities and biotech accelerators are also heavily invested in chromatography innovation for therapeutic protein and vaccine purification.
This report forecasts revenue growth at country levels and provides an analysis of the latest industry trends in each of the sub-segments from 2021 to 2033. For this study, Nova one advisor, Inc. has segmented the Asia Pacific chromatography resin market
Type
End-use
Technique
Country