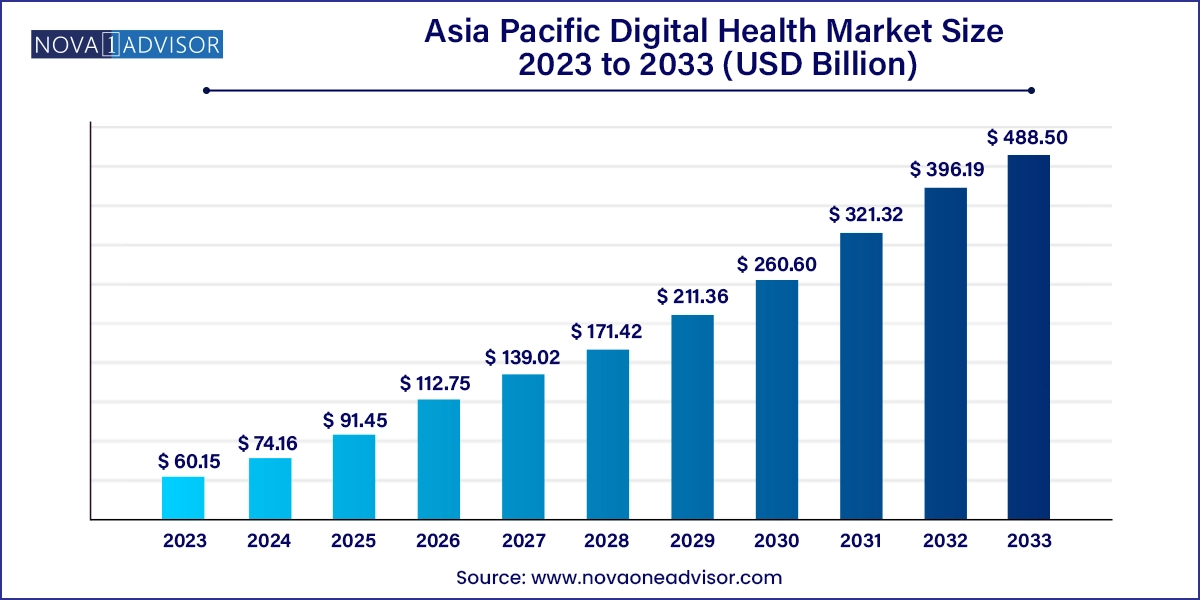
The Asia Pacific digital health market size was exhibited at USD 60.15 billion in 2023 and is projected to hit around USD 488.50 billion by 2033, growing at a CAGR of 23.3% during the forecast period 2024 to 2033.
Report Coverage | Details |
Market Size in 2024 | USD 74.16 Billion |
Market Size by 2033 | USD 488.50 Billion |
Growth Rate From 2024 to 2033 | CAGR of 23.3% |
Base Year | 2023 |
Forecast Period | 2024-2033 |
Segments Covered | Technology, Component, Application, End-use, and Country |
Market Analysis (Terms Used) | Value (US$ Million/Billion) or (Volume/Units) |
Regional Scope | Asia Pacific |
Key Companies Profiled | Veradigm LLC; Apple Inc.; Telefonica S.A.; McKesson Corp.; Epic Systems Corp.; QSI Management, LLC; AT&T; Vodafone Group; Airstrip Technologies; Google, Inc.; Samsung Electronics Co. Ltd.; HiMS; Orange; Qualcomm Technologies, Inc.; Softserve; Computer Programs & Systems, Inc.; IBM Corp.; CISCO Systems, Inc. |
Factors, such as favorable government initiatives and increasing strategic alliances, rising penetration of smartphones & tablets, increasing focus on patient-centric healthcare solutions, growing geriatric population, and rising prevalence of chronic diseases, are driving market growth. For instance, according to a study published by the Journal of Medical Internet Research in March 2023, in Japan, over 90% of adults aged 75 years or above have one chronic disease. Among those, around 80% have multiple chronic diseases.
Rising smartphone penetration, improved 5G network coverage, and increasing demand for remote patient monitoring are expected to boost the adoption of digital health platforms. For instance, according to The Mobile Economy Asia Pacific 2023, in the APAC region, there are several rapidly expanding markets for 5G, notably India, which is expected to incorporate ten million 5G connections by 2023. Furthermore, it is anticipated that by 2033, there will be around 1.4 billion 5G connections in APAC, accounting for 41% of the overall mobile connections. The growing usage of smartphones and internet connectivity has increased dependency on fitness, health, and medical applications in this region. This has resulted in a significant boost in market growth.
Furthermore, the rising incidence of chronic conditions, such as diabetes, Alzheimer's, cancer, and cardiovascular diseases, and a growing demand for fitness trackers and long-term patient monitoring solutions drive the market growth. For instance, according to the World Cancer Research Fund International, the cancer incidence rate in men in China is 2,464,015. Similarly, according to the International Diabetes Federation, 90 million people had diabetes in Southeast Asia in 2021. Furthermore, patients are shifting their focus to telehealth owing to movement restrictions and lockdowns due to the COVID-19 pandemic. For instance, MyDoc, a telehealth platform headquartered in Singapore, witnessed a 160% growth in daily active users in 2020.
Many patients, doctors, and government bodies increasingly adopt telehealth & telemedicine. Telehealth facilitates access to healthcare through specific applications & video consultations and enables communication between patients & doctors in remote locations, eliminating the need to visit hospitals or clinics. Video consultations are increasing, as they enable patients to avail medical services from their medical professional over the phone, which helps avoid unnecessary doctor visits and the process of booking appointments & commuting, thereby reducing unnecessary costs. For instance, in May 2023, Telstra Health launched Australia's first Fast Healthcare Interoperability Resources (FHIR) native virtual care solution-Virtual Health Platform-to enhance overall clinical efficiency.
Furthermore, rising government initiatives to promote digital health solutions and high adoption of advanced technology for remote health management are also anticipated to accelerate market growth in APAC. For instance, a collaboration between three government agencies in Thailand led to the developing of an IT system and mobile phone application to connect healthcare services provided by 116 government hospitals. This project has enabled Thai physicians to share medical information online, providing benefits, such as long-distance study in medical sciences, telepathology consultations, telecardiology, and teleradiology. Considering that Thailand has almost 900 government hospitals, the program has ample potential to expand in the coming years.
Several technologically advanced connected medical devices secured approval in recent years. This includes wearable devices, mobile apps, and iPad-based diagnostic tools. The approvals and launch of these technologically advanced devices into the market may aid growth. For instance, in September 2023, Lotte Healthcare, a South Korean company, entered the market by launching its personalized healthcare management platform, Cazzle.
The telehealthcare segment dominated the market with the highest revenue share of 43.21% in 2023. An increase in the number of patients suffering from conditions requiring long-term care (LTC), including Alzheimer's disease, cancer, diabetes, and cardiovascular diseases, is one of the significant factors driving the segment growth. For instance, As per the "Alzheimer's Patients Demand Insight Report" in Beijing, it is estimated that around 15.07 million people aged 60 years or above in China are suffering from dementia, out of which 9.83 million have been diagnosed with Alzheimer's disease. Furthermore, LTC conditions are a major economic burden on hospitals & clinics, expected to drive the demand for telehealthcare services for remote monitoring and physician consultation of LTC patients.
The mHealth segment held the second-highest revenue share in 2023. Increasing trend of preventive healthcare & rising funding for mHealth startups are other factors boosting the market growth. Government initiatives, such as awareness programs and R&D funding for healthcare IT, are anticipated to boost market growth. For instance, in February 2024, the “Health On Us” app was launched in Telangana, India. This app provides two main services-care at the center and care at home. Furthermore, continuous improvements in mobile app functionality by manufacturers are driving segment growth.
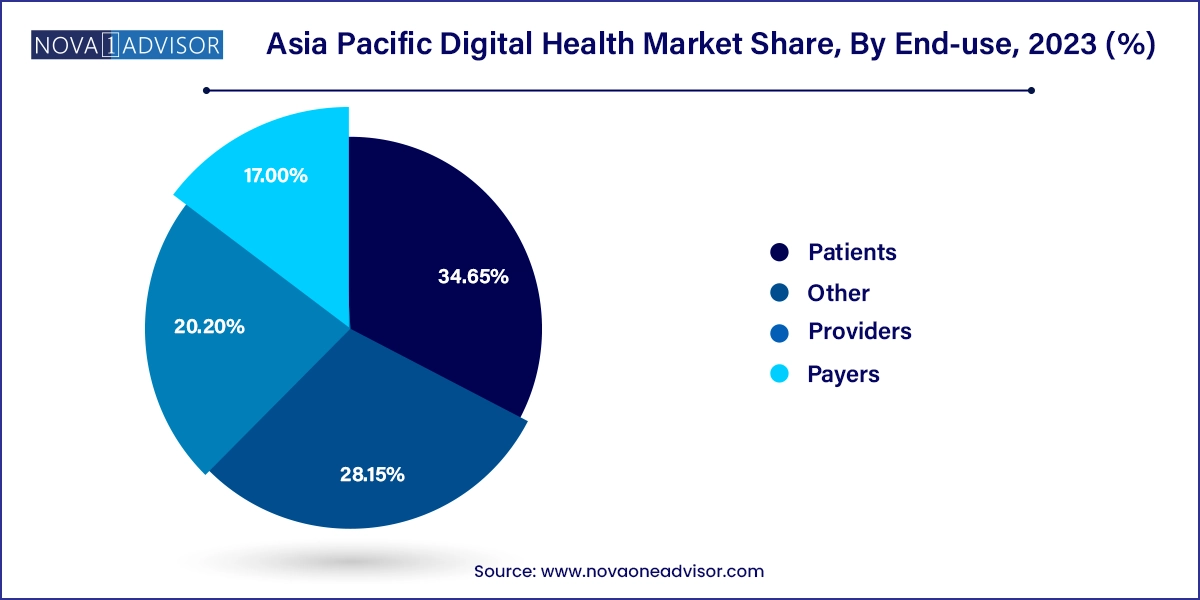
The patients segment dominated the market with a revenue share of 34.65% in 2023. Rising government initiatives and the launch of healthcare apps are anticipated to boost market growth. For instance, in July 2023, Singapore's Ministry of Health (MOH) launched the Industry Transformation Map (ITM) 2025 for healthcare, an update to the initial ITM launched in 2017. The new plan aims to strengthen various aspects of Singapore's healthcare industry, including research and innovation, healthcare workforce retention, digital systems, and partnerships. Furthermore, the shift toward patient-centered care and increased awareness of health management apps among individuals drives market growth.
The providers segment accounted for a significant share in 2023 and is expected to maintain its share throughout the forecast period. Many healthcare providers are adopting digital solutions to provide remote consultations, personalized treatment plans, and evidence-based therapies. This has made it easier for healthcare providers to work together and offer care across different settings. Moreover, these digital tools help providers save time on administrative tasks and communicate more effectively. As a result, innovative technologies, such as telemedicine and digital therapeutics, are becoming more popular in healthcare.
The services component segment accounted for the largest revenue share of 37.18% in 2023. An increase in the number of companies providing outsourcing services to healthcare facilities is anticipated to drive market growth over the forecast period. The growing trend of software upgrades to include a wider range of healthcare applications also contributes to the segment growth. Services such as installations, education & training, and upgradation depend on developing these platforms. For instance, in November 2023, Versicles Technologies, a Kerala startup, introduced a first-of-its-kind digital health kiosk that offers basic diagnostics, such as blood sugar, blood pressure, and heart conditions, with accuracy in multiple languages and at low prices, bringing healthcare facilities to the doorstep.
The software segment is expected to register the fastest CAGR throughout the forecast period. Increasing demand for reducing the rising medical costs, growing need for accurate & timely information procurement, and rising patient care costs are among the key factors responsible for the growth of the software market. The adoption of various software, such as EHRs/EMRs, has significantly increased owing to the assistance provided to healthcare systems. Periodic software upgrades are necessary to keep up with digital trends.
The diabetes segment dominated the market with the largest revenue share of 24.31% in 2023. The increasing prevalence of diabetes and the adoption of digital health solutions, such as smartphone apps for monitoring glucose levels and wearable devices that track physical activity and provide real-time health data, enable patients to actively engage in managing their diabetes. For instance, according to the International Diabetes Federation, 206 million people had diabetes in the Western Pacific region in 2021. Digital health technologies offer innovative solutions to address the needs of individuals with diabetes. For instance, MySugr, Diabetes: M, Glucose Buddy, Beat Diabetes, OneTouch Reveal, and Diabetes are some of the digital health solutions that help with diabetes monitoring.
The obesity segment is expected to register the second-fastest CAGR from 2024 to 2033. Lack of physical activity and unhealthy eating habits are the major factors contributing to increased prevalence of obesity. For instance, according to the WHO, in Southeast Asia, about 6.6 million children under the age of 5 years and one in five adults are overweight. Digital health technologies offer personalized interventions, including mobile applications for tracking dietary intake and wearable devices for monitoring physical activity, which has been driving the growth of this segment. MyFitnessPal, MyNetDiary, Noom, YAZIO, LoseIt, and MyPlate are some food-tracking apps that help manage diet plans.
India Digital Health Market Trends
The India digital health market is projected to experience significant growth over the forecast perioddue to the rising number of internet users, favorable government initiatives, and an increasing number of consumers using remote digital health services. For instance, in May 2023, the National Health Authority of India announced that over 100 health programs and digital health applications have been integrated into the Ayushman Bharat Digital Mission ecosystem. Moreover, leading hospitals in India, such as Narayana Hrudayalaya, Apollo, and AIIMS, have recognized the potential of telemedicine services and are supporting their broader implementation in the country, further driving the market growth.
China Digital Health Market Trends
The digital health market in China accounted for the highest revenue share in 2023. Increasing smartphone penetration and a rise in the number of digital health providers drive the market growth in this country. For instance, the number of active smartphone users in China was 974.7 million in 2022. Furthermore, Tencent, an internet-based technology and cultural enterprise that operates WeChat in mainland China, is developing a network of affiliated hospitals where users can easily schedule appointments, track their follow-up medical check-ups, and settle medical bills.
Singapore Digital Health Market Trends
The Singapore digital health market is projected to witness considerable growth in the coming years. Singapore is one of the first countries to adopt digital health in APAC. Telemedicine and EHR have been deployed in the country for over a decade. Singapore, as well as Australia, have one of the most advanced and largest networks of EMR systems. Moreover, Australia is a developed country with robust electronic and telecommunication technology.
Asia Pacific Digital Health Market Recent Developments
This report forecasts revenue growth at country levels and provides an analysis of the latest industry trends in each of the sub-segments from 2021 to 2033. For this study, Nova one advisor, Inc. has segmented the Asia Pacific digital health market
Technology
Component
Application
End-use
Country
Chapter 1. Methodology and Scope
1.1. Market Segmentation & Scope
1.2. Segment Definitions
1.2.1. Technology
1.2.2. Component
1.2.3. Application
1.2.4. End-use
1.3. Estimates and Forecast Timeline
1.4. Research Methodology
1.5. Information Procurement
1.5.1. Purchased Database
1.5.2. Internal Database
1.5.3. Secondary Sources
1.5.4. Primary Research
1.6. Information Analysis
1.6.1. Data Analysis Models
1.7. Market Formulation & Data Visualization
1.8. Model Details
1.8.1. Commodity Flow Analysis
1.9. List of Secondary Sources
1.10. Objectives
Chapter 2. Executive Summary
2.1. Market Snapshot
2.2. Segment Snapshot
2.2.1. Technology outlook
2.2.2. Component outlook
2.2.3. Application outlook
2.2.4. End-use outlook
2.2.5. Country outlook
2.3. Competitive Landscape Snapshot
Chapter 3. Asia Pacific Digital Health Market Variables, Trends, & Scope
3.1. Market Lineage Outlook
3.2. Market Dynamics
3.2.1. Market Driver Analysis
3.2.1.1. Increasing adoption of digital healthcare
3.2.1.2. Shortage of medical professionals and increasing demand for healthcare
3.2.1.3. Rise in artificial intelligence, IoT, and big data
3.2.1.4. Growing adoption of mobile health applications
3.2.2. Market Restraint Analysis
3.2.2.1. Cybersecurity and privacy concerns
3.2.2.2. Barriers to scalability and adoption
3.2.3. Case Study Analysis
3.3. Business Environment Analysis
3.3.1. Industry Analysis - Porter’s
3.3.1.1. Supplier power
3.3.1.2. Buyer power
3.3.1.3. Substitution threat
3.3.1.4. Threat of new entrant
3.3.1.5. Competitive rivalry
3.3.2. PEST Analysis
3.4. Regulatory Landscape
3.4.1. Asia Pacific
3.5. Case Studies
Chapter 4. Asia Pacific Digital Health Market Segment Analysis, By Technology, 2018-2030 (USD Million)
4.1. Definition and Scope
4.2. Technology Segment Dashboard
4.3. Market Size & Forecasts and Trend Analyses, 2018 to 2030 for the following
4.4. Tele-Healthcare
4.4.1. Market estimates and forecasts, 2021 to 2033
4.4.2. Telecare
4.4.2.1. Market estimates and forecasts, 2021 to 2033
4.4.2.2. Activity monitoring
4.4.2.3. Market estimates and forecasts, 2021 to 2033
4.4.2.4. Remote medication management
4.4.2.5. Market estimates and forecasts, 2021 to 2033
4.4.3. Telehealth
4.4.3.1. Market estimates and forecasts, 2018 to 2030, (USD Million)
4.4.3.2. Long-term care (LTC) monitoring
4.4.3.3. Market estimates and forecasts, 2021 to 2033
4.4.3.4. Video consultation
4.4.3.5. Market estimates and forecasts, 2021 to 2033
4.5. mHealth
4.5.1. Market estimates and forecasts, 2021 to 2033
4.5.2. Wearables & Connected Medical Devices
4.5.2.1. Market estimates and forecasts, 2021 to 2033
4.5.2.2. Vital Sign Monitoring Devices
4.5.2.2.1.Market estimates and forecasts, 2021 to 2033
4.5.2.2.2.Heart Rate Monitors
4.5.2.2.2.1. Market estimates and forecasts, 2021 to 2033
4.5.2.2.3.Activity Monitors
4.5.2.2.3.1. Market estimates and forecasts, 2021 to 2033
4.5.2.2.4.Electrocardiographs
4.5.2.2.4.1. Market estimates and forecasts, 2021 to 2033
4.5.2.2.5.Pulse Oximeters
4.5.2.2.5.1. Market estimates and forecasts, 2021 to 2033
4.5.2.2.6.Spirometers
4.5.2.2.6.1. Market estimates and forecasts, 2021 to 2033
4.5.2.2.7.Blood Pressure Monitors
4.5.2.2.7.1. Market estimates and forecasts, 2021 to 2033
4.5.2.2.8.Others
4.5.2.2.8.1. Market estimates and forecasts, 2021 to 2033
4.5.2.3. Sleep Monitoring Devices
4.5.2.3.1.Market estimates and forecasts, 2021 to 2033
4.5.2.3.2.Sleep trackers.
4.5.2.3.2.1. Market estimates and forecasts, 2021 to 2033
4.5.2.3.3.Wrist Actigraphs
4.5.2.3.3.1. Market estimates and forecasts, 2021 to 2033
4.5.2.3.4.Polysomnographs
4.5.2.3.4.1. Market estimates and forecasts, 2021 to 2033
4.5.2.3.5.Others
4.5.2.3.5.1. Market estimates and forecasts, 2021 to 2033
4.5.2.4. Electrocardiographs Fetal and Obstetric Devices
4.5.2.4.1.Market estimates and forecasts, 2021 to 2033
4.5.2.5. Neuromonitoring Devices
4.5.2.5.1.Market estimates and forecasts, 2021 to 2033
4.5.2.5.2.Electroencephalographs
4.5.2.5.3.Market estimates and forecasts, 2021 to 2033
4.5.2.5.4.Electromyographs
4.5.2.5.5.Market estimates and forecasts, 2021 to 2033
4.5.2.5.6.Others
4.5.2.5.7.Market estimates and forecasts, 2021 to 2033
4.5.3. mHealth Apps
4.5.3.1. Market estimates and forecasts, 2021 to 2033
4.5.3.2. Medical Apps
4.5.3.2.1.Market estimates and forecasts, 2021 to 2033
4.5.3.2.2.Women's Health
4.5.3.2.2.1. Market estimates and forecasts, 2021 to 2033
4.5.3.2.2.2. Menstrual Health
4.5.3.2.2.2.1. Market estimates and forecasts, 2021 to 2033
4.5.3.2.2.3. Pregnancy Tracking & Postpartum Care
4.5.3.2.2.3.1. Market estimates and forecasts, 2021 to 2033
4.5.3.2.2.4. Menopause
4.5.3.2.2.4.1. Market estimates and forecasts, 2021 to 2033
4.5.3.2.2.5. Disease Management
4.5.3.2.2.5.1. Market estimates and forecasts, 2021 to 2033
4.5.3.2.2.6. Others
4.5.3.2.2.6.1. Market estimates and forecasts, 2021 to 2033
4.5.3.2.3.Chronic Disease Management Apps
4.5.3.2.3.1. Market estimates and forecasts, 2021 to 2033
4.5.3.2.3.2. Diabetes Management Apps
4.5.3.2.3.2.1. Market estimates and forecasts, 2021 to 2033
4.5.3.2.3.3. Blood Pressure and ECG Monitoring Apps
4.5.3.2.3.3.1. Market estimates and forecasts, 2021 to 2033
4.5.3.2.3.4. Mental Health Management Apps
4.5.3.2.3.4.1. Market estimates and forecasts, 2021 to 2033
4.5.3.2.3.5. Cancer Management Apps
4.5.3.2.3.5.1. Market estimates and forecasts, 2021 to 2033
4.5.3.2.3.6. Obesity Management Apps
4.5.3.2.3.6.1. Market estimates and forecasts, 2021 to 2033
4.5.3.2.3.7. Other Chronic Disease Management Apps
4.5.3.2.3.7.1. Market estimates and forecasts, 2021 to 2033
4.5.3.2.4.Personal Health Record Apps
4.5.3.2.4.1. Market estimates and forecasts, 2021 to 2033
4.5.3.2.5.Medication Management Apps
4.5.3.2.5.1. Market estimates and forecasts, 2021 to 2033
4.5.3.2.6.Diagnostic Apps
4.5.3.2.6.1. Market estimates and forecasts, 2021 to 2033
4.5.3.2.7.Remote Monitoring Apps
4.5.3.2.7.1. Market estimates and forecasts, 2021 to 2033
4.5.3.2.8.Others (Medical Reference, Professional Networking, Healthcare Education)
4.5.3.2.8.1. Market estimates and forecasts, 2021 to 2033
4.5.3.3. Fitness Apps
4.5.3.3.1.Market estimates and forecasts, 2021 to 2033
4.5.3.3.2.Exercise & Fitness
4.5.3.3.2.1. Market estimates and forecasts, 2021 to 2033
4.5.3.3.3.Diet & Nutrition
4.5.3.3.3.1. Market estimates and forecasts, 2021 to 2033
4.5.3.3.4.Lifestyle & Stress
4.5.3.3.4.1. Market estimates and forecasts, 2021 to 2033
4.6. Services
4.6.1. Market estimates and forecasts, 2021 to 2033
4.6.2. Monitoring Services
4.6.2.1. Market estimates and forecasts, 2021 to 2033
4.6.2.2. Independent Aging Solutions
4.6.2.2.1.Market estimates and forecasts, 2021 to 2033
4.6.2.3. Chronic Disease Management & Post-Acute Care Services
4.6.2.3.1.Market estimates and forecasts, 2021 to 2033
4.6.3. Diagnosis Services
4.6.3.1. Market estimates and forecasts, 2021 to 2033
4.6.4. Healthcare Systems Strengthening Services
4.6.4.1. Market estimates and forecasts, 2021 to 2033
4.6.5. Others
4.6.5.1. Market estimates and forecasts, 2021 to 2033
4.7. Digital Health Systems
4.7.1. Market estimates and forecasts, 2021 to 2033
4.7.2. EHR
4.7.2.1. Market estimates and forecasts, 2021 to 2033
4.7.3. E-prescribing Systems
4.7.3.1. Market estimates and forecasts, 2021 to 2033
4.8. Healthcare Analytics
4.8.1. Market estimates and forecasts, 2021 to 2033
Chapter 5. Asia Pacific Digital Health Market Segment Analysis, By Component, 2018-2030 (USD Million)
5.1. Definition and Scope
5.2. Component Segment Dashboard
5.3. Market Size & Forecasts and Trend Analyses, 2018 to 2030 for the following
5.4. Software
5.4.1. Market estimates and forecasts, 2021 to 2033
5.5. Hardware
5.5.1. Market estimates and forecasts, 2021 to 2033
5.6. Services
5.6.1. Market estimates and forecasts, 2021 to 2033
Chapter 6. Asia Pacific Digital Health Market Segment Analysis, By Application, 2018-2030 (USD Million)
6.1. Definition and Scope
6.2. Application Segment Dashboard
6.3. Market Size & Forecasts and Trend Analyses, 2018 to 2030 for the following
6.4. Obesity
6.4.1. Market estimates and forecasts, 2021 to 2033
6.5. Diabetes
6.5.1. Market estimates and forecasts, 2021 to 2033
6.6. Cardiovascular
6.6.1. Market estimates and forecasts, 2021 to 2033
6.7. Respiratory Diseases
6.7.1. Market estimates and forecasts, 2021 to 2033
6.8. Neurology
6.8.1. Market estimates and forecasts, 2021 to 2033
6.9. Others
6.9.1. Market estimates and forecasts, 2021 to 2033
Chapter 7. Asia Pacific Digital Health Market Segment Analysis, By End-use, 2018-2030 (USD Million)
7.1. Definition and Scope
7.2. End Use Segment Dashboard
7.3. Market Size & Forecasts and Trend Analyses, 2018 to 2030 for the following
7.4. Patients
7.4.1. Market estimates and forecasts, 2021 to 2033
7.5. Providers
7.5.1. Market estimates and forecasts, 2021 to 2033
7.6. Payers
7.6.1. Market estimates and forecasts, 2021 to 2033
7.7. Others
7.7.1. Market estimates and forecasts, 2021 to 2033
Chapter 8. Asia Pacific Digital Health Market Segment Analysis, By Region, By Technology, By Component, By Application, By End-use, 2021 - 2033 (USD Million)
8.1. Regional Market Share Analysis, 2024 & 2033
8.2. Regional Market Dashboard
8.3. Country Market Share Analysis, 2024 & 2033
8.4. Country Market Dashboard
8.5. Market Size, & Forecasts Trend Analysis, 2018 to 2030
8.6. SWOT Analysis
8.7. Asia Pacific
8.7.1. China
8.7.1.1. Key country dynamics
8.7.1.2. Regulatory framework/ reimbursement structure
8.7.1.3. Competitive scenario
8.7.1.4. China market estimates and forecasts, 2021 to 2033
8.7.2. Japan
8.7.2.1. Key country dynamics
8.7.2.2. Regulatory framework/ reimbursement structure
8.7.2.3. Competitive scenario
8.7.2.4. Japan market estimates and forecasts, 2021 to 2033
8.7.3. India
8.7.3.1. Key country dynamics
8.7.3.2. Regulatory framework/ reimbursement structure
8.7.3.3. Competitive scenario
8.7.3.4. India market estimates and forecasts, 2021 to 2033
8.7.4. Australia
8.7.4.1. Key country dynamics
8.7.4.2. Regulatory framework/ reimbursement structure
8.7.4.3. Competitive scenario
8.7.4.4. Australia market estimates and forecasts, 2021 to 2033
8.7.5. South Korea
8.7.5.1. Key country dynamics
8.7.5.2. Regulatory framework/ reimbursement structure
8.7.5.3. Competitive scenario
8.7.5.4. South Korea market estimates and forecasts, 2021 to 2033
8.7.6. Singapore
8.7.6.1. Key country dynamics
8.7.6.2. Regulatory framework/ reimbursement structure
8.7.6.3. Competitive scenario
8.7.6.4. Singapore market estimates and forecasts, 2021 to 2033
Chapter 9. Competitive Landscape
9.1. Recent Developments & Impact Analysis, by Key Market Participants
9.2. Company Categorization
9.3. Company Profiles
9.3.1. Veradigm
9.3.1.1. Overview
9.3.1.2. Financial Performance
9.3.1.3. Service Benchmarking
9.3.1.4. Strategic Initiatives
9.3.2. Apple Inc
9.3.2.1. Overview
9.3.2.2. Financial Performance
9.3.2.3. Service Benchmarking
9.3.2.4. Strategic Initiatives
9.3.3. Telefonica S.A.
9.3.3.1. Overview
9.3.3.2. Financial Performance
9.3.3.3. Service Benchmarking
9.3.3.4. Strategic Initiatives
9.3.4. McKesson Corporation
9.3.4.1. Overview
9.3.4.2. Financial Performance
9.3.4.3. Service Benchmarking
9.3.4.4. Strategic Initiatives
9.3.5. Epic Systems Corporation
9.3.5.1. Overview
9.3.5.2. Financial Performance
9.3.5.3. Service Benchmarking
9.3.5.4. Strategic Initiatives
9.3.6. QSI Management, LLC.
9.3.6.1. Overview
9.3.6.2. Financial Performance
9.3.6.3. Service Benchmarking
9.3.6.4. Strategic Initiatives
9.3.7. AT&T
9.3.7.1. Overview
9.3.7.2. Financial Performance
9.3.7.3. Service Benchmarking
9.3.7.4. Strategic Initiatives
9.3.8. Vodafone Group
9.3.8.1. Overview
9.3.8.2. Financial Performance
9.3.8.3. Service Benchmarking
9.3.8.4. Strategic Initiatives
9.3.9. Airstrip Technologies
9.3.9.1. Overview
9.3.9.2. Financial Performance
9.3.9.3. Service Benchmarking
9.3.9.4. Strategic Initiatives
9.3.10. Google, Inc
9.3.10.1. Overview
9.3.10.2. Financial Performance
9.3.10.3. Service Benchmarking
9.3.10.4. Strategic Initiatives
9.3.11. Samsung Electronics Co. Ltd
9.3.11.1. Overview
9.3.11.2. Financial Performance
9.3.11.3. Service Benchmarking
9.3.11.4. Strategic Initiatives
9.3.12. HiMS
9.3.12.1. Overview
9.3.12.2. Financial Performance
9.3.12.3. Service Benchmarking
9.3.12.4. Strategic Initiatives
9.3.13. Orange
9.3.13.1. Overview
9.3.13.2. Financial Performance
9.3.13.3. Service Benchmarking
9.3.13.4. Strategic Initiatives
9.3.14. Qualcomm Technologies, Inc
9.3.14.1. Overview
9.3.14.2. Financial Performance
9.3.14.3. Service Benchmarking
9.3.14.4. Strategic Initiatives
9.3.15. Softserve
9.3.15.1. Overview
9.3.15.2. Financial Performance
9.3.15.3. Service Benchmarking
9.3.15.4. Strategic Initiatives
9.3.16. Computer Programs and Systems, Inc
9.3.16.1. Overview
9.3.16.2. Financial Performance
9.3.16.3. Service Benchmarking
9.3.16.4. Strategic Initiatives
9.3.17. IBM Corporation
9.3.17.1. Overview
9.3.17.2. Financial Performance
9.3.17.3. Service Benchmarking
9.3.17.4. Strategic Initiatives
9.3.18. CISCO Systems, Inc
9.3.18.1. Overview
9.3.18.2. Financial Performance
9.3.18.3. Service Benchmarking
9.3.18.4. Strategic Initiatives