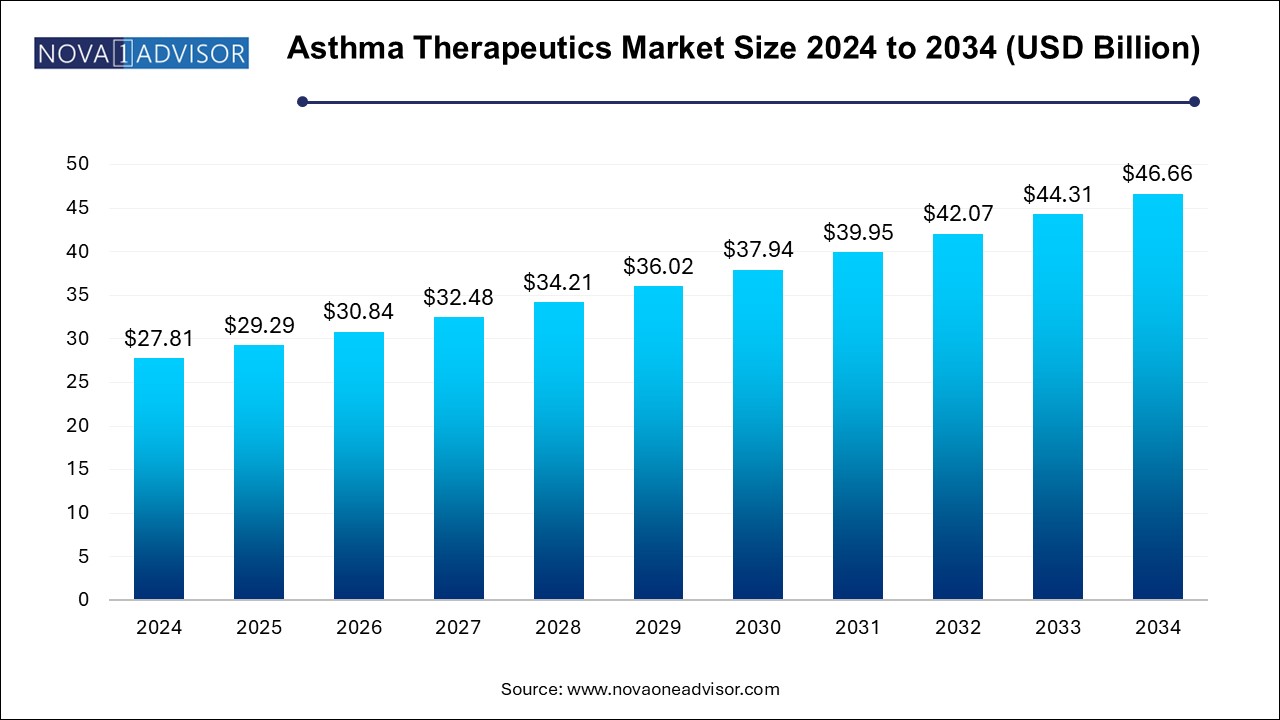
The global asthma therapeutics market size was valued at USD 27.81 billion in 2024 and is anticipated to reach around USD 46.66 billion by 2034, growing at a CAGR of 5.31% from 2025 to 2034.

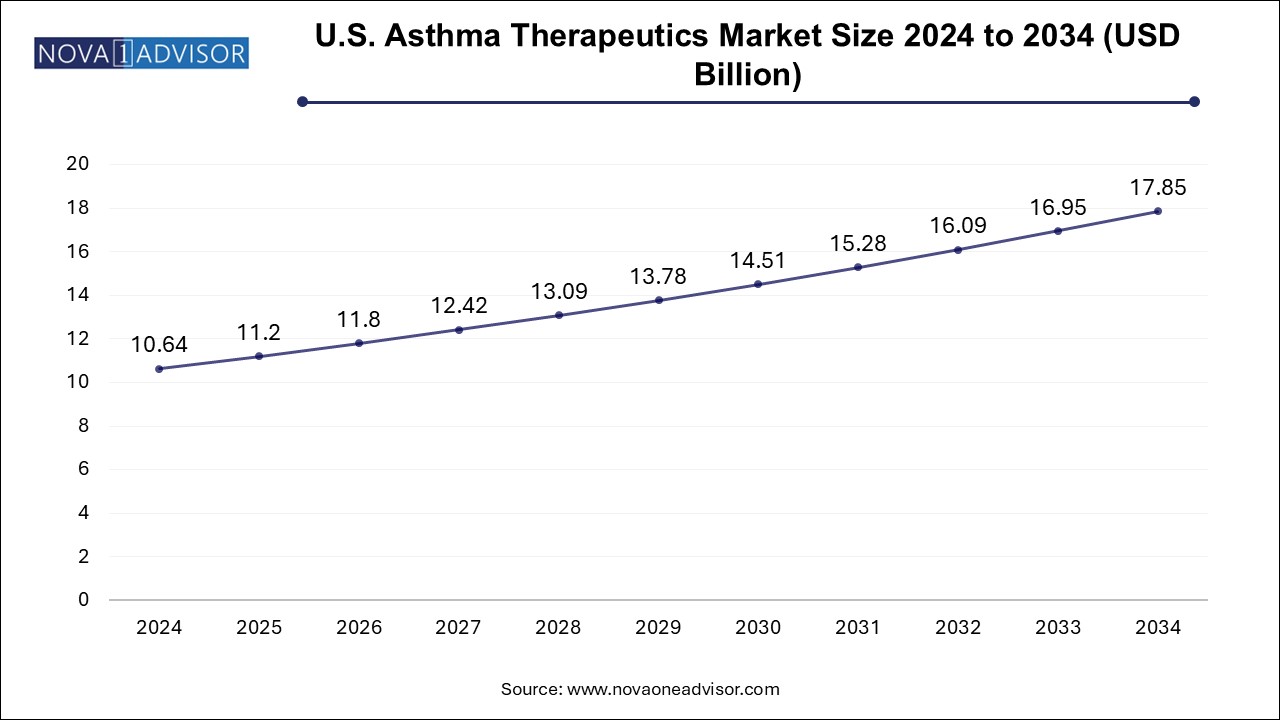
The U.S. asthma therapeutics market size was estimated at USD 10.64 billion in 2024 and is projected to hit around USD 17.85 billion by 2034, growing at a CAGR of 4.81% during the forecast period from 2025 to 2034.

North America dominated the market and accounted for a share of 51.00% in 2024. with the United States leading in drug consumption, R&D, and innovation. Strong reimbursement structures, high diagnosis rates, and access to cutting-edge biologics and smart inhalers have made the region a hub for asthma therapy adoption. The U.S. FDA has played a proactive role in approving advanced therapies and facilitating faster market access through expedited review pathways.
Furthermore, growing awareness campaigns led by organizations like the Asthma and Allergy Foundation of America (AAFA), coupled with favorable payer coverage, continue to drive therapeutic uptake. North America is also at the forefront of integrating digital health solutions into asthma care, including smart inhalers and telemedicine platforms.
Asia-Pacific is expected to be the fastest-growing region, driven by increasing asthma incidence, urbanization, pollution levels, and enhanced healthcare access. Countries such as China and India are witnessing rapid growth in diagnosed cases due to improving diagnostic protocols and growing healthcare infrastructure. Governments across the region are rolling out national asthma management programs and increasing funding for respiratory care.
The market is also benefitting from the rising availability of generic asthma medications and expanding presence of multinational pharmaceutical companies. With expanding middle-class populations and growing demand for quality respiratory treatments, Asia-Pacific is poised to emerge as a key growth engine for the asthma therapeutics industry.
The asthma therapeutics market represents one of the most dynamic sectors within the respiratory healthcare domain, addressing a chronic, inflammatory disease that affects the airways of the lungs. Characterized by symptoms such as wheezing, breathlessness, chest tightness, and coughing, asthma remains a major public health issue worldwide, with over 300 million affected individuals as of 2024, according to WHO estimates.
The therapeutic landscape has evolved significantly over the past two decades. From short-acting bronchodilators used during acute exacerbations, the industry has transitioned toward combination therapies, inhaled corticosteroids (ICS), biologics targeting eosinophilic pathways, and smart inhalers that enable real-time monitoring of medication adherence. These innovations are enhancing patient outcomes while reducing hospitalizations and long-term healthcare costs.
The increasing prevalence of asthma, growing awareness, improved diagnostic protocols, and availability of advanced inhalation therapies are fueling demand for both acute and maintenance medications. Environmental factors such as pollution, allergens, and climate change are further exacerbating asthma incidence and severity, particularly in urban regions. Furthermore, rising healthcare expenditure and insurance coverage for respiratory treatments are creating favorable market conditions.
While the market is already well-established in developed regions, emerging economies are rapidly catching up due to increased access to healthcare infrastructure, adoption of generic asthma medications, and government-supported respiratory disease management programs. With new drug classes such as monoclonal antibodies and biologic inhalables gaining traction, the asthma therapeutics market is poised for robust growth through 2034.
Rise of Biologics and Targeted Therapies: Monoclonal antibodies such as omalizumab and mepolizumab are becoming mainstream for severe eosinophilic asthma.
Smart Inhalers and Digital Adherence Monitoring: Integration of Bluetooth-enabled inhalers and mobile apps is improving compliance and remote monitoring.
Shift Toward Combination Therapy: ICS/LABA and ICS/LABA/LAMA combinations are preferred due to better symptom control and reduced exacerbation rates.
Personalized and Phenotype-Based Treatments: Tailoring therapies based on biomarkers like blood eosinophil counts and FeNO is gaining clinical acceptance.
Inhaler Innovation: Development of soft mist inhalers and dry powder devices that improve drug deposition in the lungs and reduce coordination errors.
Increased Generic and Biosimilar Approvals: Regulatory focus on cost reduction is leading to increased availability of generics and biosimilars, particularly in ICS and LABA categories.
Telehealth-Driven Respiratory Care: Virtual consultations are driving demand for easy-to-use inhalers and home-based nebulizer devices.
Environmental and Lifestyle Factors Driving Incidence: Urban air pollution, smoking, indoor allergens, and sedentary lifestyles are contributing to increasing asthma burden.
| Report Attribute | Details |
| Market Size in 2025 | USD 29.29 Billion |
| Market Size by 2034 | USD 46.66 Billion |
| Growth Rate From 2025 to 2034 | CAGR of 5.39% |
| Base Year | 2024 |
| Forecast Period | 2025 to 2034 |
| Segments Covered | Drug Class, Product, Route of Administration, Region |
| Market Analysis (Terms Used) | Value (US$ Million/Billion) or (Volume/Units) |
| Report Coverage | Revenue forecast, company ranking, competitive landscape, growth factors, and trends |
| Key Companies Profiled | Teva Pharmaceutical Industries Ltd.; GSK plc; Merck & Co., Inc.; F. Hoffmann-La Roche Ltd.; AstraZeneca; Boehringer Ingelheim International GmbH; Sanofi; Koninklijke Philips N.V., BD; Covis Pharma |
A central driver of the asthma therapeutics market is the rising global prevalence of asthma coupled with significant levels of underdiagnosis and undertreatment. In the United States alone, over 25 million people are living with asthma, including 5.1 million children. Despite these numbers, many patients remain undiagnosed or inadequately treated, especially in socioeconomically disadvantaged populations.
This trend creates opportunities for both pharmaceutical companies and healthcare providers to improve screening, diagnosis, and therapy initiation. The widespread availability of spirometry, improved primary care education, and use of symptom-based diagnostic tools are enabling earlier detection, leading to an increase in long-term treatment initiation. With environmental risk factors intensifying globally, the incidence is expected to rise further, driving sustained market demand for therapeutic interventions.
Despite therapeutic advancements, the high cost of biologic therapies remains a major barrier to access, especially for patients with moderate-to-severe asthma. Monoclonal antibodies such as dupilumab, benralizumab, and tezepelumab can cost between $30,000 to $50,000 annually per patient, placing a significant burden on both public and private payers.
These pricing dynamics limit the uptake of biologics to insured or high-income patients and create disparities in asthma care outcomes. Additionally, the need for biomarker testing and specialist consultation before initiation further restricts widespread adoption. While biosimilar development may eventually lower prices, current high costs are a notable restraint on broader market penetration of advanced therapies.
A compelling opportunity in the asthma therapeutics space is the emergence of smart inhaler technologies, which incorporate sensors, mobile apps, and data analytics to track medication usage, adherence, and environmental triggers. These devices not only improve medication compliance but also empower patients and caregivers through personalized insights and reminders.
Smart inhalers can transmit data to healthcare providers in real-time, enabling proactive interventions in case of symptom deterioration. With increasing smartphone penetration and rising acceptance of digital health tools, these connected devices are becoming integral to asthma management, especially among pediatric and elderly populations. As payer interest in outcome-based reimbursement grows, the combination of pharmacologic therapy with digital adherence solutions represents a strong growth vector.
The anti-inflammatory segment led the market and accounted for a revenue share of 63.10% in 2024 driven by the expanding pool of patients with severe asthma who are unresponsive to standard treatments. The segment includes corticosteroids, anti-IgE, anti-IL-5, and anti-IL-13 agents. As more monoclonal antibodies gain FDA approval, and real-world data supports their efficacy in reducing exacerbations and hospitalizations, the demand for precision anti-inflammatory treatments is rising sharply.
The combination therapy segment is expected to register the fastest CAGR from 2025 to 2034, particularly the ICS/LABA combination used in both maintenance and rescue treatments. Fixed-dose combinations offer the advantage of reducing dosing complexity and improving patient compliance. Formulations like fluticasone/salmeterol and budesonide/formoterol remain bestsellers due to their ability to manage both inflammation and bronchoconstriction. With clinical guidelines now endorsing combination therapy even in mild asthma cases, this segment continues to see significant expansion.
The inhalers segment accounted for the largest revenue share in 2024. with metered dose and dry powder inhalers being the most prescribed delivery systems. Their portability, rapid onset, and ease of use make them the primary choice for both acute and maintenance therapy. Dry powder inhalers (DPIs), which eliminate the need for propellants and hand-breath coordination, are increasingly preferred by both clinicians and patients.
Soft mist inhalers and nebulizers are gaining traction, especially among pediatric, elderly, and severely ill populations who may have difficulty using conventional inhalers. Nebulizers are especially critical in hospital or emergency settings, and their use has expanded in home care during the post-COVID era. As innovations make nebulizers more compact and silent, their market adoption is expected to grow, particularly in emerging economies.
The inhaled route of administration segment accounted for the largest revenue share 40.0 in 2024. as it allows direct delivery of medication to the lungs with minimal systemic absorption. Inhaled corticosteroids and bronchodilators remain foundational in both acute and chronic management of asthma. Inhaled drugs also minimize side effects compared to systemic administration, supporting widespread clinical preference.
The oral segment is projected to witness the highest growth rate from 2025 to 2034. particularly in the anti-inflammatory drug class. Leukotriene receptor antagonists (e.g., montelukast) are widely prescribed oral agents, especially in pediatric populations and those with allergic asthma. The segment also includes systemic corticosteroids for severe exacerbations. While not the first-line choice for maintenance, oral agents are an important part of the comprehensive asthma treatment toolkit.
In March 2025, AstraZeneca announced promising Phase III trial results for its biologic "Tezepelumab" in reducing asthma exacerbations in patients with uncontrolled moderate-to-severe asthma.
In January 2025, GlaxoSmithKline received expanded FDA approval for its triple-combination inhaler "Trelegy Ellipta" to include use in asthma patients previously unresponsive to dual therapy.
In October 2024, Propeller Health partnered with Express Scripts to integrate its digital inhaler platform into managed care settings, enabling adherence tracking for asthma patients under Medicaid plans.
In August 2024, Boehringer Ingelheim launched its soft mist inhaler "Respimat 2.0" with a focus on improving pediatric usability and environmental sustainability.
In July 2024, Cipla launched a new DPI variant under its “Synchrobreathe” line in India and Southeast Asia, targeting the growing demand for affordable asthma therapy in emerging markets.
Some of the key players operating in market include Teva Pharmaceutical Industries Ltd, GSK plc, Merck & Co., Inc. and Koninklijke Philips N.V.
CHIESI USA, Inc. and Areteia Therapeutics are some of the emerging market participants in the asthma therapeutics market.
Asthma Therapeutics Market Top Key Companies:
This report forecasts revenue growth at country levels and provides an analysis of the latest industry trends in each of the sub-segments from 2021 to 2034. For this study, Nova one advisor, Inc. has segmented the Asthma Therapeutics market.
By Drug Class
By Product
By Route of Administration
By Region