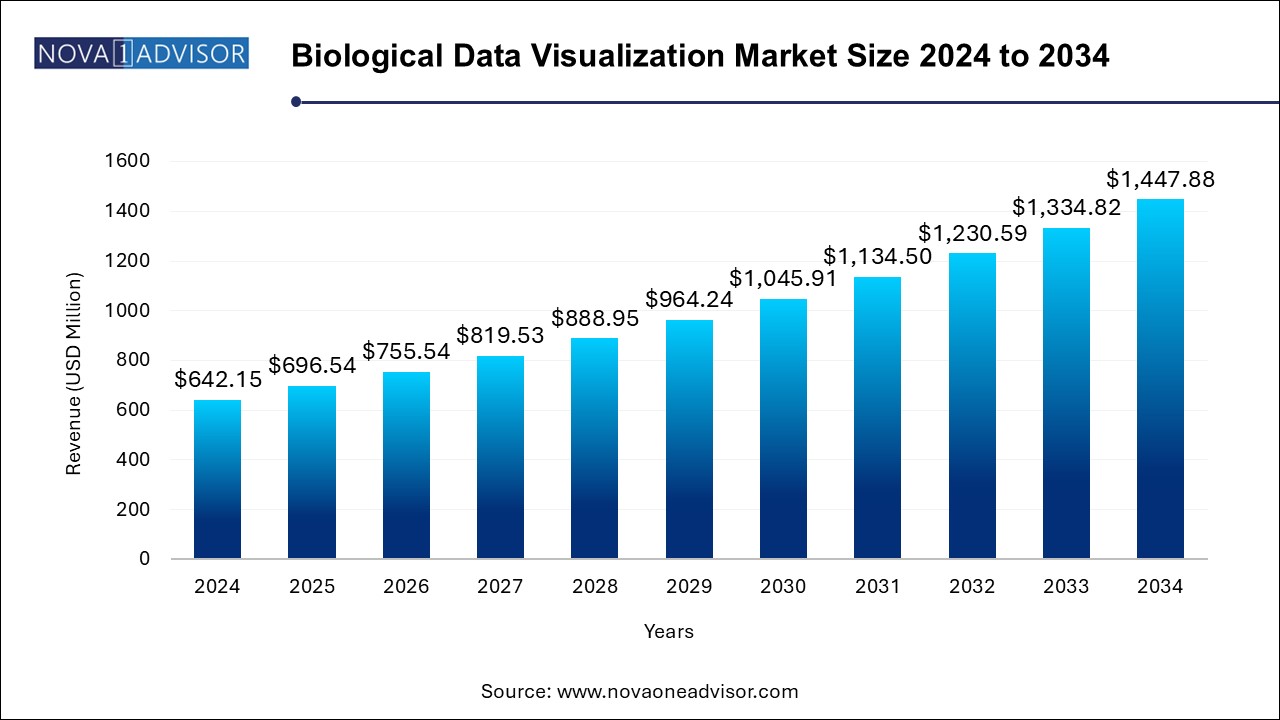
The biological data visualization market size was exhibited at USD 642.15 million in 2024 and is projected to hit around USD 1,447.88 million by 2034, growing at a CAGR of 8.47% during the forecast period 2024 to 2034. The advent of Artificial Intelligence (AI) in the analysis of biological information and the growing requirement for rapid decision-making through bioinformatics is likely to become a major determinant of market growth.

The Biological Data Visualization Market represents a transformative intersection of life sciences and digital technology, enabling researchers and clinicians to interpret and communicate complex biological data more efficiently. As modern biological studies ranging from genomics to molecular biology generate increasingly large datasets, the demand for tools that can transform raw data into meaningful visuals is growing rapidly. Visualization platforms not only simplify interpretation but also accelerate scientific discovery, enhance diagnostic accuracy, and support decision-making in clinical and research environments.
Biological data visualization encompasses techniques and software tools used to graphically represent biological information such as genomic sequences, protein structures, metabolic pathways, and cellular interactions. These visuals help bridge the gap between big data and human cognition, especially in disciplines where traditional tabular or textual data presentation fails to capture intricate patterns and relationships.
Fueled by increasing investments in genomic research, precision medicine, drug development, and computational biology, the market is expanding across multiple application domains. With significant advancements in imaging technologies, sequencing platforms, and bioinformatics tools, biological data visualization has become indispensable to both academic institutions and commercial enterprises. Moreover, the rise of AI and machine learning is adding another dimension to this market, offering predictive visual analytics and real-time interpretation capabilities.
Integration of AI in Visualization Tools: Machine learning algorithms are now embedded in biological visualization platforms to automate pattern recognition and data interpretation.
Cloud-Based Visualization Platforms: Increased adoption of cloud infrastructure enables remote access to visualization tools, facilitating global collaborations and large-scale data storage.
Interoperability with Multi-Omics Data: Tools that integrate genomic, proteomic, transcriptomic, and metabolomic data are gaining traction for holistic biological understanding.
3D and Augmented Reality (AR) in Molecular Visualization: Researchers are increasingly using immersive technologies to explore protein folding and molecular interactions.
Open-Source Tool Adoption: Academic researchers are embracing customizable, cost-effective open-source platforms such as Cytoscape and BioJS.
Visualization for Personalized Medicine: Growing focus on patient-specific visual modeling of disease pathways to aid in personalized treatment strategies.
Real-time Visualization Capabilities: Live tracking of cell behavior and drug response through dynamic visualization platforms in pharmaceutical R&D.
Visualization Tools for CRISPR and Gene Editing: Specialized tools are emerging to support CRISPR-based genomic editing analysis.
| Report Coverage | Details |
| Market Size in 2025 | USD 696.54 Million |
| Market Size by 2034 | USD 1,447.88 Million |
| Growth Rate From 2024 to 2034 | CAGR of 8.47% |
| Base Year | 2024 |
| Forecast Period | 2024-2034 |
| Segments Covered | Technique, Application, Platform, End-use, Region |
| Market Analysis (Terms Used) | Value (US$ Million/Billion) or (Volume/Units) |
| Regional scope | North America; Europe; Asia Pacific; Latin America; MEA |
| Key Companies Profiled | Thermo Fisher Scientific, Inc.; 3M; Tableau Software, LLC; QIAGEN; ZEISS International; Oxford Instruments; Olympus Corporation; General Electric Company; Agilent Technologies Inc.; Clarivate |
One of the most significant drivers of the biological data visualization market is the exponential increase in biological data complexity. From next-generation sequencing (NGS) to systems biology experiments, the modern biological landscape is data-rich but insight-poor. Traditional spreadsheet-based analysis cannot keep pace with the volume and intricacy of datasets that include gene expressions, protein interactions, metabolic fluxes, and clinical metadata. Visualization tools help in structuring this data into understandable formats, identifying relationships, and drawing meaningful conclusions.
For example, in oncogenomics, researchers utilize heatmaps, network graphs, and survival curves to investigate gene mutation frequencies, expression levels, and clinical outcomes across patient cohorts. These visuals provide a direct window into patterns that would otherwise remain obscured in data silos. As datasets grow due to improved sensors and sequencing tools, demand for high-resolution, interactive visualization tools rises in parallel.
A critical restraint for the market is the lack of standardization across biological data sources, which hampers interoperability between datasets and visualization platforms. Biological data often originates from diverse experimental techniques, with varying formats, resolutions, and nomenclature systems. This heterogeneity makes it challenging to create unified visualizations without substantial preprocessing, which in turn increases time, cost, and computational load.
For instance, gene expression data obtained from microarrays may not directly align with RNA-Seq outputs, yet both need to be integrated for a comprehensive visualization in transcriptomics studies. While some tools offer format conversion or normalization features, these are often limited in scope and require domain expertise to execute effectively.
The growing momentum of personalized medicine presents a lucrative opportunity for the biological data visualization market. Personalized medicine requires the integration and interpretation of individual-level omics data such as genomes, proteomes, and metabolomes alongside clinical histories and lifestyle data. Visualization tools that can synthesize these complex, multidimensional datasets into intuitive and actionable visuals are poised for high demand.
For example, cancer treatment decision support systems often utilize heatmaps, clustering, and pathway visualization to identify mutations and inform therapeutic strategies. Tools like cBioPortal or OncoPrinter provide user-friendly dashboards that clinicians use to visualize patient-specific cancer profiles. As healthcare shifts toward more individualized care, the visualization platforms that support such analyses will see increased funding, partnerships, and commercialization.
Sequencing dominated the biological data visualization market by technique due to its foundational role in genomic and transcriptomic studies. The widespread adoption of next-generation sequencing (NGS) in fields such as oncology, infectious disease, and precision medicine has necessitated robust visualization tools to interpret sequence alignment, variant annotation, and gene expression profiles. Software like Integrative Genomics Viewer (IGV) and Geneious enables scientists to explore large volumes of sequence data using intuitive interfaces and dynamic filters, allowing better hypothesis generation and decision-making.
Meanwhile, Microscopy is the fastest-growing technique segment, driven by the rise of advanced imaging methods like super-resolution microscopy, live-cell imaging, and cryo-electron microscopy. The biological imaging field is expanding with tools that visualize not only cellular morphology but also subcellular processes in real time. Integration of microscopy visualization with machine learning has led to automated identification of cell structures, aiding research in neuroscience, developmental biology, and pathology.
Genomic Analysis emerged as the leading application segment owing to its deep integration in precision medicine, pharmacogenomics, and disease gene mapping. Visualization of gene sequences, variants, and annotations is fundamental to identifying disease-associated mutations and understanding hereditary traits. Tools like UCSC Genome Browser and Ensembl provide dynamic graphical representations of genome features and evolutionary conservation, empowering bioinformaticians and clinical researchers alike.
Systems Biology is witnessing the fastest growth in this category, thanks to its emphasis on modeling complex biological networks. Visualization in systems biology typically includes pathway maps, network graphs, and flux diagrams that show how genes, proteins, and metabolites interact dynamically. These tools are critical in identifying biomarkers and designing synthetic biology interventions, especially in pharmaceutical R&D where understanding pathway perturbations is crucial.
Windows remains the dominant platform for biological data visualization, mainly due to its extensive compatibility with commercial bioinformatics software and widespread institutional use. Many legacy visualization tools, including PyMOL and DNASTAR Lasergene, were designed for Windows environments, leading to entrenched user preferences and IT infrastructure alignment within academic and commercial research labs.
However, Linux is the fastest-growing platform, particularly within bioinformatics and computational biology circles. Its open-source nature, robust command-line utilities, and high-performance computing (HPC) compatibility make it ideal for large-scale biological data processing and visualization. Tools like Bioconductor, Cytoscape, and GenomeTools are often optimized for Linux, contributing to its rapid uptake in research environments.
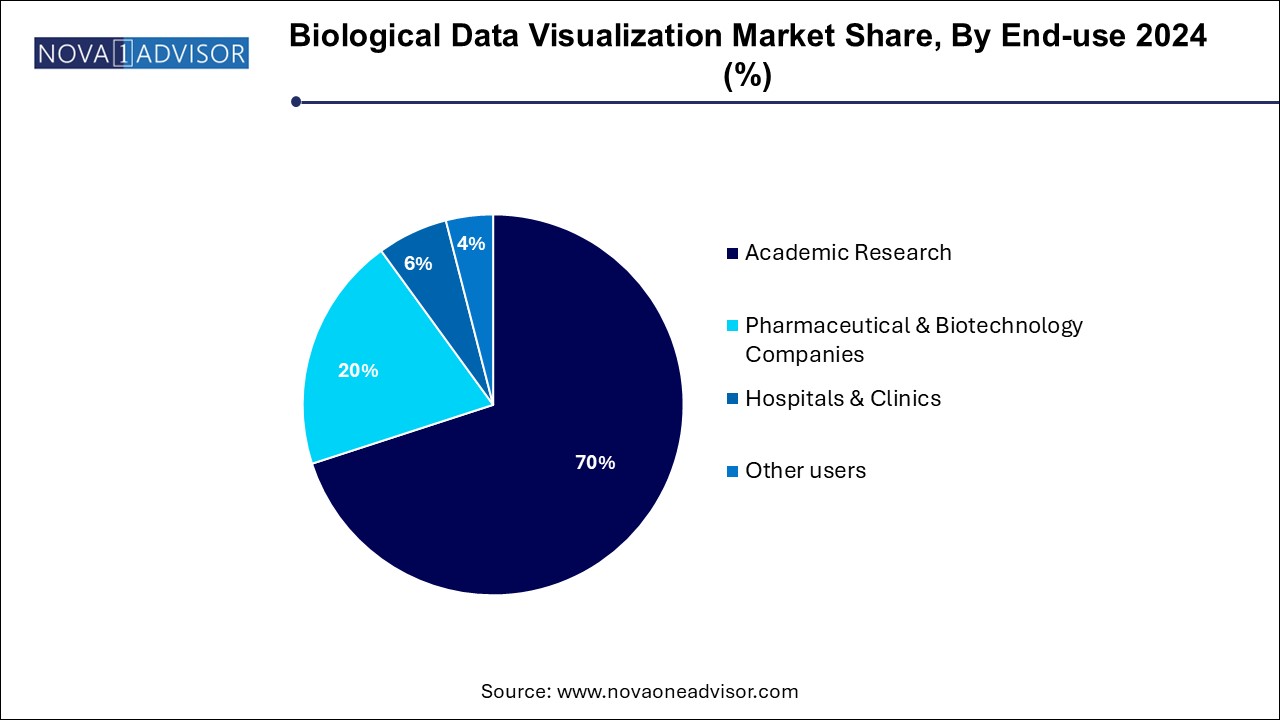
Academic Research dominates the market in terms of end use, owing to the high volume of exploratory biological studies conducted in universities and research institutes. These institutions frequently use visualization to illustrate gene pathways, evolutionary trees, and cell architecture in publications and teaching. Open-source visualization platforms like RStudio (ggplot2), BioRender, and VMD are commonly deployed to support such educational and discovery-based research activities.

In contrast, Pharmaceutical & Biotechnology Companies represent the fastest-growing end-user segment. These companies are leveraging biological data visualization in areas such as drug discovery, preclinical validation, biomarker discovery, and clinical trial stratification. Advanced visualization tools integrated into drug development pipelines help identify target interactions, visualize disease progression, and monitor drug efficacy, significantly reducing time-to-market.
North America leads the global biological data visualization market, bolstered by strong investments in biomedical research, cutting-edge infrastructure, and a robust biotech ecosystem. Major institutions like the NIH, Broad Institute, and pharmaceutical giants like Pfizer and Genentech heavily invest in visualization technologies to streamline their R&D processes. Moreover, the U.S. healthcare system’s shift toward personalized medicine and digital transformation further propels the adoption of visualization platforms. Government initiatives supporting open-access biological data (e.g., The Cancer Genome Atlas) have also enhanced visualization tool development and uptake.
On the other hand, Asia Pacific is the fastest-growing regional market, fueled by rising genomic research activities, improving healthcare IT infrastructure, and increasing collaborations with global pharma players. Countries like China, Japan, South Korea, and India are investing heavily in genomics, AI-driven drug discovery, and translational medicine. For example, India’s Genomics for Public Health project and China’s precision medicine initiatives are opening new avenues for visualization tool deployment. The expansion of biotech startups and growing adoption of cloud-based research platforms further accelerates market growth in the region.
March 2025 – Thermo Fisher Scientific announced an upgrade to its visualization tools for next-gen sequencing data, incorporating machine learning for enhanced genomic annotation.
February 2025 – QIAGEN launched a new version of its CLC Genomics Workbench with improved structural variant visualization and real-time cloud collaboration features.
January 2025 – Agilent Technologies partnered with a healthtech startup in Singapore to develop AI-powered biological imaging visualization tools for cancer diagnostics.
December 2024 – PerkinElmer released new modules for its Signals platform to integrate multi-omics visualization, supporting faster data interpretation for drug development.
November 2024 – BioRender raised $20 million in Series B funding to expand its visual science communication tools, targeting broader academic and pharmaceutical markets.
This report forecasts revenue growth at country levels and provides an analysis of the latest industry trends in each of the sub-segments from 2021 to 2034. For this study, Nova one advisor, Inc. has segmented the biological data visualization market
Technique
Application
Platform
End-use
Regional