Cancer Treatment Facilities Market Size, Share, & Trends Analysis Report By Treatment (Cancer Surgery, Chemotherapy), By Cancer Type (Blood Cancer, Breast Cancer), By Provider, By Region, And Segment)- Global Industry Analysis, Size, Share, Growth, Trends, Regional Outlook, and Forecast 2024-2033

Cancer Treatment Facilities Market Size and Growth

The global cancer treatment facilities market size was valued at USD 47.19 billion in 2023 and is anticipated to reach around USD 99.73 billion by 2033, growing at a CAGR of 7.77% from 2024 to 2033.
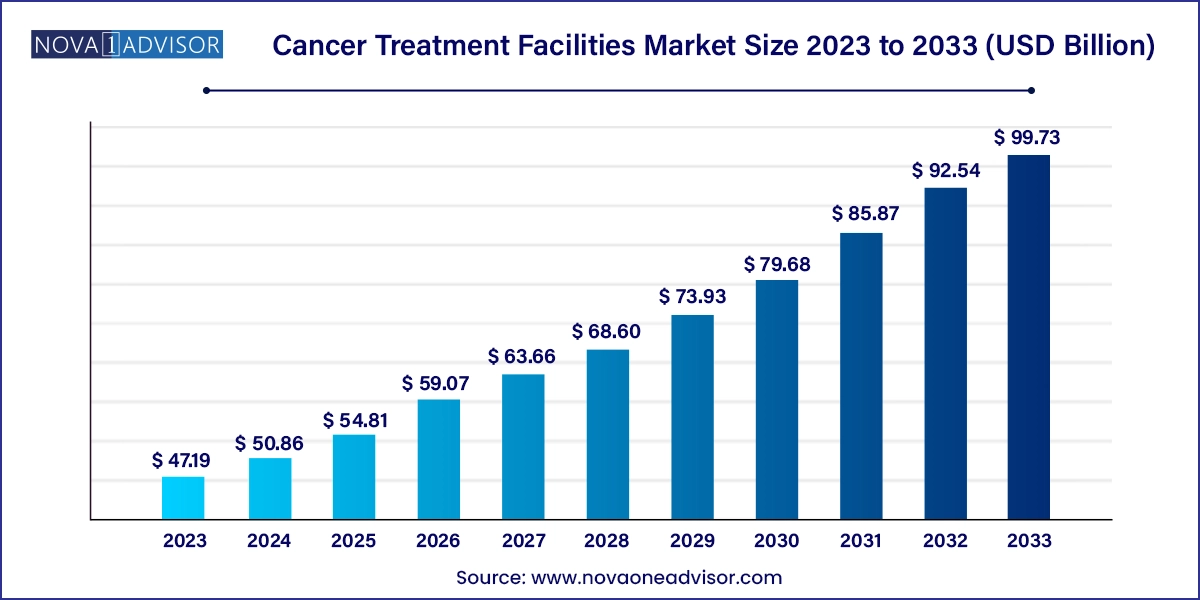
Cancer Treatment Facilities Market Size, 2024 to 2033

Cancer Treatment Facilities Market Key Takeaways

  • The Asia Pacific cancer treatment facilities market held the largest global revenue share of 37.94% in 2023 and is expected to witness the fastest CAGR over the forecast period.
  • The cancer treatment facilities market in North America held the second-largest global revenue share in 2023
  • Based on treatment, the cancer surgery segment dominated the market with a revenue share of 34.72% in 2023.
  • The chemotherapy segment is expected to grow significantly during the forecast period.
  • Based on cancer type, the blood cancer segment dominated the market in 2023 with a revenue share of 25.83%.
  • The prostate cancer segment is expected to grow at the fastest CAGR over the forecast period.
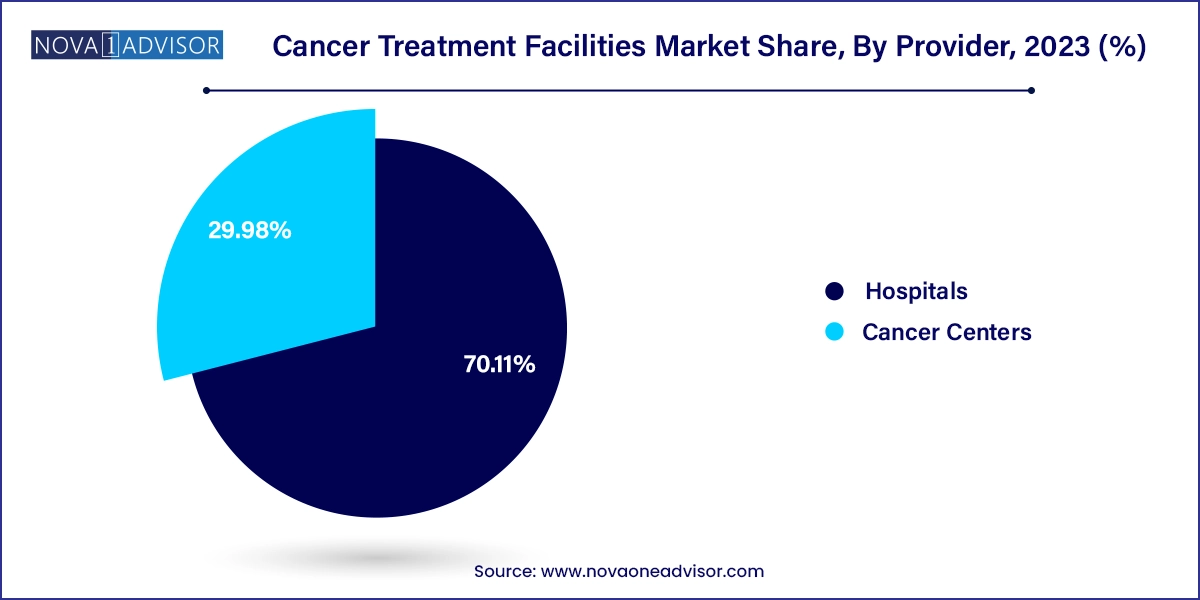
  • Based on provider, the hospitals segment dominated the market with a revenue share of 69.89% in 2023.
  • The cancer centers segment is expected to grow at the fastest CAGR during the forecast period.

Cancer Treatment Facilities Market Growth 

The market is expected to increase significantly due to a rise in cancer prevalence and increasing international tourism with the presence of numerous international malignant treatment facility providers that attract patients across the globe. Moreover, the growing advancement in medical technology to boost digital presence and enhance end-to-end patient engagement drives market growth and better realizations.

The growing prevalence of cancer leads to a rise in demand for advanced treatment facilities. According to the World Health Organization (WHO) cancer agency, the International Agency for Research on Cancer (IARC) published an estimate that around 20 million new cancer cases and 9.7 million deaths occurred across 115 countries in 2022. It is estimated to reach around 35 million new cases by 2050. In addition, around 1 out of 5 people are diagnosed with malignancy in their lifetime, and approximately 1 in 12 women and 1 in 9 men die due to the disease.

Furthermore, the increasing demand for cancer treatment centers has led the health facility provider to increase their presence to ensure the availability of treatment services. For instance, in April 2024, RUSH University System for Health partnered with The University of Texas MD Anderson Cancer Center to build RUSH MD Anderson Cancer Center in the Chicago area. The aim of this new cancer center is to provide advanced clinical and operational integration in the delivery of oncology care to RUSH patients and access to cancer treatment and research. This rapid global expansion of new treatment facilities is expected to fuel market growth.

Cancer Treatment Facilities Market Report Scope

Report Attribute Details
Market Size in 2024 USD 50.86 Billion
Market Size by 2033 USD 99.73 Billion
Growth Rate From 2024 to 2033 CAGR of 7.77%
Base Year 2023
Forecast Period 2024 to 2033
Segments Covered Treatment, cancer type, provider, region
Market Analysis (Terms Used) Value (US$ Million/Billion) or (Volume/Units)
Report Coverage Revenue forecast, company ranking, competitive landscape, growth factors, and trends
Key Companies Profiled Compass Oncology; American Oncology Institute; Mayo Foundation for Medical Education and Research (MFMER); HCA International Limited; The Royal Marsden; National Cancer Institute at the National Institutes of Health; Apollo Hospitals Enterprise Ltd.; Kokilaben Dhirubhai Ambani Hospital; HEALTHCARE GLOBAL ENTERPRISES LIMITED; The Johns Hopkins Hospital, Tata Memorial Centre.

Cancer Treatment Facilities Industry Dynamics

The chart below illustrates the relationship between industry concentration, industry characteristics, and industry participants. The x-axis represents the level of industry concentration, ranging from low to high. The y-axis represents various market characteristics, including industry competition, degree of innovation, impact of regulations, level of partnerships & collaborations activities, service expansion, and regional expansion. For instance, the industry is fragmented, with many service providers entering the industry. The degree of innovation is high, and the level of partnerships & collaboration activities is also moderate. The impact of regulations on the market is high, service expansion is high, and the regional expansion of the industry is moderate.

Cancer research is producing an impressive range of potential new treatments, including targeted therapies that directly kill cancerous cells and immunotherapies that activate the immune system to fight malignance. Innovative therapies like antibody-drug conjugates (ADCs) are proving vastly more effective than previous treatments. Scientists are also exploring ways to enhance cell therapies through combinations with other agents.

The industry has a moderate level of partnerships and collaborations as service providers engage in joint activities to expand their presence and offer treatment services. For instance, in April 2024, the University of Maryland Medical Center (UMMC) partnered with AstraZeneca, a biopharmaceutical company, with funding of over USD 8 million for the next five years. The partnership aims to provide easy access to lung cancer screening and early detection that leads to earlier diagnosis and several treatment options for patients across the Maryland community.

Regulations significantly impact the industry. Various regulatory authorities oversee laws and regulations, depending on the health departments of different countries. In India, the Ministry of Health and Family Welfare manages cancer control programs and treatment facilities. In addition, the Atomic Energy Regulatory Board (AERB) regulates radiation therapy equipment and facilities, and the National Cancer Grid coordinates treatment guidelines and standards across centers.

Service providers across the globe are undertaking strategic initiatives to expand facilities to rural areas, reducing the need for patients and their caregivers to travel to hospitals and giving them more time to go about their daily lives. For instance, in April 2024, the Department of Veterans Affairs, a part of the Biden Cancer Moonshot , expanded its Close to Me cancer care program. This program allows Veteran Affairs clinicians to provide Veterans with comprehensive care at close community-based patient clinics, including the rural locations. The expansion aims to open new treatment, surveillance, and diagnosis services to an added 9,000 Veterans and 30 places by the end of October 2025.

The level of regional expansion in the industry is moderate due to the growing need for advanced treatment in populated areas, which are experiencing significant growth in the industry. For instance, in May 2024, Healthcare Global Enterprises Limited, a healthcare provider, expanded its cancer care centers to two locations such as North Bengaluru and Whitefield in Bengaluru in India. The new locations offer personalized treatment, high-precision diagnosis, and comprehensive care, and these centers are to be operational in early 2025.

U.S. Cancer Treatment Facilities Market By Treatment Insights

Based on treatment, the cancer surgery segment dominated the market with a revenue share of 34.72% in 2023. The development and increasing adoption of robotic surgery techniques is having a significant impact on the growth of the segment. Robotic surgery offers enhanced precision, dexterity, and visualization for surgeons, leading to improved patient outcomes and driving greater demand for these advanced procedures. However, advancements in systemic treatments, such as targeted therapies and immunotherapies, are also shaping the market. These innovative treatments are providing new options for patients, which can impact the need for certain surgical interventions.

Moreover, the chemotherapy segment is expected to grow significantly during the forecast period. The growth of this segment can be attributed to the presence of numerous chemotherapy treatment providers and the easy treatment of various types of cancer. The wait time for treatment is less compared to other treatments, and the shortage of bed capacity for tumor treatment by chemotherapy is increasing.

This shortage is driving the demand for treatment facilities. According to a survey conducted by the National Comprehensive Cancer Network (NCCN) in May 2023, in the U.S., about 2 million people were diagnosed with cancer, and there was over a 90% shortage of chemotherapy treatment due to a shortage of drugs. These factors are anticipated to drive the demand for facilities with better treatment infrastructure to meet the demand for chemotherapy treatment.

U.S. Cancer Treatment Facilities Market By Cancer Type Insights

Based on cancer type, the blood cancer segment dominated the market in 2023 with a revenue share of 25.83%. The ongoing research and clinical trials focusing on novel therapies continue to expand treatment options and improve patient outcomes, driving investment and specialization in blood cancer care within treatment facilities. Moreover, the increasing prevalence of blood cancers, attributed to factors such as aging populations and environmental influences, underscores the growing demand for specialized treatment facilities equipped to manage these complex diseases. For instance, in June 2024, UC Health opened a Blood Cancer Healing Center to improve care for people with blood cancers. They also have plans to open more space in 2024 and 2025, including a research lab for new treatments and wellness areas for food as medicine, mind, and movement therapies.

The prostate cancer segment is expected to grow at the fastest CAGR over the forecast period. The rising prevalence of prostate cancer cases is boosting demand for therapies. According to WHO estimates, approximately 1.5 million cases of prostate cancer will be reported globally in 2024. The rising prevalence of cancer, advancements in diagnostic technologies and screening methods, and government initiatives for new treatments are positively impacting the segment growth during the forecast period.

U.S. Cancer Treatment Facilities Market By Provider Insights

Based on provider, the hospitals segment dominated the market with a revenue share of 69.89% in 2023. The increasing global incidence of oncological diseases, along with the availability of advanced diagnostic tools, multidisciplinary medical teams, and surgical expertise in hospitals, has led to a growing demand for more advanced treatment technologies. Hospitals offer a wide range of therapy options, including chemotherapy, hormone therapy, and radiotherapy, making them a preferred choice for patients due to their advanced treatment capabilities. For instance, in March 2024, Fortis Healthcare announced plans to invest in oncology facilities, including MR LINAC and Gamma Knife technologies. These investments will expand bed capacity and lead to significant upgrades in various locations across North India.

Cancer Treatment Facilities Market Share, By Provider, 2023 (%)

The cancer centers segment is expected to grow at the fastest CAGR during the forecast period. The rise in demand for high-quality care and in-person treatment is increasing the demand for specialized centers to meet the demand. The rising number of cancer centers providing high-quality, patient-centric treatment for specific tumors, leading to the opening of new centers across the countries, is anticipated to drive market growth. For instance, in April 2024, St. Elizabeth Healthcare opened its St. Elizabeth Dearborn Cancer Center in Southeastern Indiana. This center strives to provide quality care and convenient access to cancer prevention, screening, and treatment.

U.S. Cancer Treatment Facilities Market By Regional Insights

The cancer treatment facilities market in North America held the second-largest global revenue share in 2023. This can be attributed to the rise in investment in research and development activities and the presence of major players in the region. Furthermore, the rise in the adoption of cancer therapy and the growing incidence of cancer in the U.S. and Canada are expected to fuel the industry's growth.

U.S. Cancer Treatment Facilities Market Trends

The U.S. cancer treatment facilities marketheld the largest revenue share in 2023 in the North American region due to the ongoing demand for personalized and multidisciplinary approaches to attract medical tourists seeking quality cancer care. Renowned cancer hospitals, a growing network of research institutions and clinical trials, and the availability of cutting-edge technologies have all contributed to offering patients innovative therapies and treatment options.

Asia Pacific Cancer Treatment Facilities Market Trends

The Asia Pacific cancer treatment facilities marketheld the largest global revenue share of 37.94% in 2023 and is expected to witness the fastest CAGR over the forecast period. The increasing medical tourism, growing awareness of early diagnosis and treatment, rising investment in oncology research & development, and the presence of cost-effective facilities available are expected to offer better cancer treatment for patients and anticipated to drive the market growth.

The China cancer treatment facilities market held the largest revenue share in 2023 in the Asia Pacific region, due to the increasing demand for advanced monitoring and diagnostic technologies driven by the rising cases of cancer in the country. The increase in cancer cases is attributed to factors such as the growing number of cigarette smokers and specific dietary habits. In addition, the rising number of campaign programs aimed at creating awareness about cancer, such as the Basic Plan to Promote Cancer Control Programs, has contributed to this trend.

The cancer treatment facilities market in India is driven by factors such as the presence of cost-effective treatment options equipped with innovative technology. This is leading to an increase in medical tourists seeking affordable and high-quality cancer treatment. Furthermore, healthcare providers and the government are increasing their investments to expand their presence across the country and provide better cancer treatment facilities. For instance, in June 2024, Morgan Stanley announced an investment of USD 59.85 million in Omega Hospitals, a cancer-focused hospital chain, to acquire a 23% stake in the hospital.

Europe Cancer Treatment Facilities Market Trends

The cancer treatment facilities marketin Europe is anticipated to grow significantly due to increasing government initiatives supporting cancer care and research. Additionally, the rise in collaborations between academic institutions, research centers, and pharmaceutical companies is creating a dynamic environment for clinical trials and the development of advanced treatments, further driving market growth.

The UK cancer treatment facilities market is expected to grow significantly over the forecast period. This growth can be attributed to an increase in medical tourism and collaboration between oncology professionals to provide improved cancer treatment, coupled with the presence of the National Health Service (NHS), offering comprehensive care for cancer patients, ensuring access to innovative treatment modalities, clinical trials, and multidisciplinary expertise.

The cancer treatment facilities market in Germany held the largest share in the European region in 2023, owing to the presence of a well-established network of specialized cancer treatment centers equipped with state-of-the-art technology for early detection, diagnosis, and treatment of various cancer types. Additionally, Germany's stringent regulatory frameworks contributed to its position as a hub for cancer treatment facilities in Europe, providing high-quality treatment to both domestic and international patients.

Latin America Cancer Treatment Facilities Market Trends

The cancer treatment facilities marketin Latin America is anticipated to grow significantly due to increasing investment in the healthcare sector and the rising adoption of advanced cancer treatment technologies aimed at providing better treatment facilities. There is also a growing demand for personalized treatment plans tailored to each patient's unique needs, driven by a growing population affected by cancer.

The Brazil cancer treatment facilities market is expected to experience substantial growth due to the presence of well-known cancer centers equipped with cutting-edge technologies and offering a multidisciplinary approach to care.

Middle East & Africa Cancer treatment facilities market

The cancer treatment facilities marketin the Middle East and Africa is anticipated to grow significantly due to the growing governments and private sectors in the region enhancing healthcare facilities, expanding oncology departments, and adopting state-of-the-art diagnostic and treatment equipment. Moreover, an increase in collaboration with international healthcare providers and research institutions further supports the development of specialized cancer treatment centers, offering a comprehensive range of therapies, including surgery, chemotherapy, radiation therapy, and targeted therapies is expected to fuel the market.

South Africa cancer treatment facilities market is anticipated to grow significantly due to the increase in demand for advanced cancer treatment due to the incidence of cancer in country and rise in favorable measures are undertaken to develop the cancer treatment facilities in the region which is expected to fuel the market.

Cancer Treatment Facilities Market Top Key Companies:

  • Compass Oncology
  • American Oncology Institute
  • Mayo Foundation for Medical Education and Research (MFMER)
  • HCA International Limited
  • The Royal Marsden
  • National Cancer Institute at the National Institutes of Health
  • Apollo Hospitals Enterprise Ltd.
  • Kokilaben Dhirubhai Ambani Hospital
  • HEALTHCARE GLOBAL ENTERPRISES LIMITED
  • The Johns Hopkins Hospital
  • Tata Memorial Centre.

Cancer Treatment Facilities Market Recent Developments

  • In April 2024, President of India, Droupadi Murmu, launched India's first home produced CAR T-cell therapy for cancer treatment. The NexCAR19 therapy, developed by IIT Bombay and Tata Memorial Centre, represents a significant breakthrough that will substantially reduce treatment costs.
  • In March 2024, City of Hope launched its Cell Therapy Program and Blood and Marrow Transplantation at City of Hope Cancer Center Atlanta. 
  • In January 2024, Apollo Cancer Centers has launched India's first AI-precision oncology Centre. This Centre will aid oncologists, patients, and caregivers in achieving optimal results promptly, harnessing the extensive capabilities of AI.

Cancer Treatment Facilities Market Report Segmentation

This report forecasts revenue growth at country levels and provides an analysis of the latest industry trends in each of the sub-segments from 2021 to 2033. For this study, Nova one advisor, Inc. has segmented the Cancer Treatment Facilities market.

By Treatment 

  • Bone Marrow Transplantation
  • Chemotherapy
  • Radiation Therapy
  • Hormone Therapy
  • Immunotherapy
  • Cancer Surgery

By Cancer Type 

  • Blood Cancer
  • Breast Cancer
  • Prostate Cancer
  • Gastrointestinal Cancer
  • Gynecologic Cancer
  • Respiratory/Lung Cancer
  • Other Cancer Type

By Provider 

  • Cancer Centers
  • Hospitals

By Region

  • North America
  • Europe
  • Asia-Pacific
  • Latin America
  • Middle East & Africa (MEA)

Frequently Asked Questions

The global cancer treatment facilities market size was valued at USD 47.19 billion in 2023 and is anticipated to reach around USD 99.73 billion by 2033

The global cancer treatment facilities market is expected to grow at a compound annual growth rate of 7.77% from 2024 to 2033 to reach USD 99.73 billion by 2033.

Some prominent players in the condom market include Compass Oncology; American Oncology Institute; Mayo Foundation for Medical Education and Research (MFMER); HCA International Limited; The Royal Marsden; National Cancer Instituteat the National Institutes of Health; Apollo Hospitals Enterprise Ltd.; Kokilaben Dhirubhai Ambani Hospital; HEALTHCARE GLOBAL ENTERPRISES LIMITED; The Johns Hopkins Hospital, Tata Memorial Center.

Chapter 1. Methodology and Scope
                    1.1. Market Segmentation & Scope
                    1.2. Segment Definitions
                        1.2.1. Treatment
                        1.2.2. Cancer Type
                        1.2.3. Provider
                    1.3. Estimates and Forecast Timeline
                    1.4. Research Methodology
                    1.5. Information Procurement
                        1.5.1. Purchased Database
                        1.5.2. nova one advisor Internal Database
                        1.5.3. Secondary Sources
                        1.5.4. Primary Research
                    1.6. Information Analysis
                        1.6.1. Data Analysis Models
                    1.7. Market Formulation & Data Visualization
                    1.8. Model Details
                        1.8.1. Volume Price Analysis
                    1.9. List of Secondary Sources
                    1.10. Objectives
Chapter 2. Executive Summary
                    2.1. Market Snapshot
                    2.2. Segment Snapshot
                    2.3. Competitive Landscape Snapshot
Chapter 3. Market Variables, Trends, & Scope
                    3.1. Market Lineage Outlook
                    3.2. Market Dynamics
                        3.2.1. Market Driver Analysis
                            3.2.1.1. Increasing incidence of cancers
                            3.2.1.2. Technology advancement
                            3.2.1.3. Rising medical tourism
                            3.2.1.4. Growing government investment in cancer treatment facility
                        3.2.2. Market Restraint Analysis
                            3.2.2.1. High initial investment cost to setup cancer treatment facility
                            3.2.2.2. Stringent regulations for cancer treatment facility setup
                    3.3. Business Environment Analysis
                        3.3.1. Porter’s Five Forces Analysis
                            3.3.1.1. Supplier power
                            3.3.1.2. Buyer power
                            3.3.1.3. Substitution threat
                            3.3.1.4. Threat of new entrant
                            3.3.1.5. Competitive rivalry
                        3.3.2. PESTLE Analysis
Chapter 4. Cancer Treatment Facilities Market: Treatment Estimates & Trend Analysis
                    4.1. Treatment Market Share, 2024 & 2033
                    4.2. Treatment Segment Dashboard
                    4.3. Market Size & Forecasts and Trend Analysis, by Treatment, 2021 to 2033 (USD Million)
                    4.4. Bone Marrow Transplantation
                        4.4.1. Bone marrow transplantation market estimates and forecasts, 2021 - 2033 (USD Million)
                    4.5. Chemotherapy
                        4.5.1. Chemotherapy market estimates and forecasts, 2021 - 2033 (USD Million)
                    4.6. Radiation Therapy
                        4.6.1. Radiation therapy market estimates and forecasts, 2021 - 2033 (USD Million)
                    4.7. Hormone Therapy
                        4.7.1. Hormone therapy market estimates and forecasts, 2021 - 2033 (USD Million)
                    4.8. Immunotherapy
                        4.8.1. Immunotherapy market estimates and forecasts, 2021 - 2033 (USD Million)
                    4.9. Cancer Surgery
                        4.9.1. Cancer surgery market estimates and forecasts, 2021 - 2033 (USD Million)
Chapter 5. Cancer Treatment Facilities Market: Cancer Type Estimates & Trend Analysis
                    5.1. Cancer Type Market Share, 2024 & 2033
                    5.2. Cancer Type Segment Dashboard
                    5.3. Market Size & Forecasts and Trend Analyses, by Cancer type, 2021 to 2033 (USD Million)
                    5.4. Blood Cancer
                        5.4.1. Blood cancer market estimates and forecasts, 2021 - 2033 (USD Million)
                    5.5. Breast Cancer
                        5.5.1. Breast cancer market estimates and forecasts, 2021 - 2033 (USD Million)
                    5.6. Prostate Cancer
                        5.6.1. Prostate cancer market estimates and forecasts, 2021 - 2033 (USD Million)
                    5.7. Gastrointestinal Cancer
                        5.7.1. Gastrointestinal cancer market estimates and forecasts, 2021 - 2033 (USD Million)
                    5.8. Gynecologic Cancer
                        5.8.1. Gynecologic cancer market estimates and forecasts, 2021 - 2033 (USD Million)
                    5.9. Respiratory/Lung Cancer
                        5.9.1. Respiratory/Lung cancer market estimates and forecasts, 2021 - 2033 (USD Million)
                    5.10. Other Cancer Types
                        5.10.1. Other cancer types market estimates and forecasts, 2021 - 2033 (USD Million)
Chapter 6. Cancer Treatment Facilities Market: Provider Estimates & Trend Analysis
                    6.1. Provider Market Share, 2024 & 2033
                    6.2. Provider Segment Dashboard
                    6.3. Market Size & Forecasts and Trend Analyses, by Provider, 2021 to 2033 (USD Million)
                    6.4. Cancer Centers
                        6.4.1. Cancer centers market estimates and forecasts, 2021 - 2033 (USD Million)
                    6.5. Hospitals
                        6.5.1. Hospitals market estimates and forecasts, 2021 - 2033 (USD Million)
Chapter 7. Cancer Treatment Facilities Market: Regional Estimates & Trend Analysis
                    7.1. Regional Market Share Analysis, 2024 & 2033
                    7.2. Regional Market Dashboard
                    7.3. Market Size, & Forecasts Trend Analysis, 2021 to 2033
                    7.4. North America
                        7.4.1. North America cancer treatment facilities market estimates and forecasts, 2021 - 2033 (USD Million)
                        7.4.2. U.S.
                            7.4.2.1. Key country dynamic
                            7.4.2.2. Regulatory framework
                            7.4.2.3. Competitive insights
                            7.4.2.4. U.S. cancer treatment facilities market estimates and forecasts, 2021 - 2033 (USD Million)
                        7.4.3. Canada
                            7.4.3.1. Key country dynamic
                            7.4.3.2. Regulatory framework
                            7.4.3.3. Competitive insights
                            7.4.3.4. Canada cancer treatment facilities market estimates and forecasts, 2021 - 2033 (USD Million)
                        7.4.4. Mexico
                            7.4.4.1. Key country dynamic
                            7.4.4.2. Regulatory framework
                            7.4.4.3. Competitive insights
                            7.4.4.4. Mexico cancer treatment facilities market estimates and forecasts, 2021 - 2033 (USD Million)
                    7.5. Europe
                        7.5.1. Europe cancer treatment facilities market estimates and forecasts, 2021 - 2033 (USD Million)
                        7.5.2. Germany
                            7.5.2.1. Key country dynamic
                            7.5.2.2. Regulatory framework
                            7.5.2.3. Competitive insights
                            7.5.2.4. Germany cancer treatment facilities market estimates and forecasts, 2021 - 2033 (USD Million)
                        7.5.3. UK
                            7.5.3.1. Key country dynamic
                            7.5.3.2. Regulatory framework
                            7.5.3.3. Competitive insights
                            7.5.3.4. UK cancer treatment facilities market estimates and forecasts, 2021 - 2033 (USD Million)
                        7.5.4. France
                            7.5.4.1. Key country dynamic
                            7.5.4.2. Regulatory framework
                            7.5.4.3. Competitive insights
                            7.5.4.4. France cancer treatment facilities market estimates and forecasts, 2021 - 2033 (USD Million)
                        7.5.5. Italy
                            7.5.5.1. Key country dynamic
                            7.5.5.2. Regulatory framework
                            7.5.5.3. Competitive insights
                            7.5.5.4. Italy cancer treatment facilities market estimates and forecasts, 2021 - 2033 (USD Million)
                        7.5.6. Spain
                            7.5.6.1. Key country dynamic
                            7.5.6.2. Regulatory framework
                            7.5.6.3. Competitive insights
                            7.5.6.4. Spain cancer treatment facilities market estimates and forecasts, 2021 - 2033 (USD Million)
                        7.5.7. Denmark
                            7.5.7.1. Key country dynamic
                            7.5.7.2. Regulatory framework
                            7.5.7.3. Competitive insights
                            7.5.7.4. Denmark cancer treatment facilities market estimates and forecasts, 2021 - 2033 (USD Million)
                        7.5.8. Sweden
                            7.5.8.1. Key country dynamic
                            7.5.8.2. Regulatory framework
                            7.5.8.3. Competitive insights
                            7.5.8.4. Sweden cancer treatment facilities market estimates and forecasts, 2021 - 2033 (USD Million)
                        7.5.9. Norway
                            7.5.9.1. Key country dynamic
                            7.5.9.2. Regulatory framework
                            7.5.9.3. Competitive insights
                            7.5.9.4. Norway cancer treatment facilities market estimates and forecasts, 2021 - 2033 (USD Million)
                    7.6. Asia Pacific
                        7.6.1. Asia Pacific cancer treatment facilities market estimates and forecasts, 2021 - 2033 (USD Million)
                        7.6.2. Japan
                            7.6.2.1. Key country dynamic
                            7.6.2.2. Regulatory framework
                            7.6.2.3. Competitive insights
                            7.6.2.4. Japan cancer treatment facilities market estimates and forecasts, 2021 - 2033 (USD Million)
                        7.6.3. China
                            7.6.3.1. Key country dynamic
                            7.6.3.2. Regulatory framework
                            7.6.3.3. Competitive insights
                            7.6.3.4. China cancer treatment facilities market estimates and forecasts, 2021 - 2033 (USD Million)
                        7.6.4. India
                            7.6.4.1. Key country dynamic
                            7.6.4.2. Regulatory framework
                            7.6.4.3. Competitive insights
                            7.6.4.4. India cancer treatment facilities market estimates and forecasts, 2021 - 2033 (USD Million)
                        7.6.5. South Korea
                            7.6.5.1. Key country dynamic
                            7.6.5.2. Regulatory framework
                            7.6.5.3. Competitive insights
                            7.6.5.4. South Korea cancer treatment facilities market estimates and forecasts, 2021 - 2033 (USD Million)
                        7.6.6. Australia
                            7.6.6.1. Key country dynamic
                            7.6.6.2. Regulatory framework
                            7.6.6.3. Competitive insights
                            7.6.6.4. Australia cancer treatment facilities market estimates and forecasts, 2021 - 2033 (USD Million)
                        7.6.7. Thailand
                            7.6.7.1. Key country dynamic
                            7.6.7.2. Regulatory framework
                            7.6.7.3. Competitive insights
                            7.6.7.4. Thailand cancer treatment facilities market estimates and forecasts, 2021 - 2033 (USD Million)
                    7.7. Latin America
                        7.7.1. Latin America cancer treatment facilities market estimates and forecasts, 2021 - 2033 (USD Million)
                        7.7.2. Brazil
                            7.7.2.1. Key country dynamic
                            7.7.2.2. Regulatory framework
                            7.7.2.3. Competitive insights
                            7.7.2.4. Brazil cancer treatment facilities market estimates and forecasts, 2021 - 2033 (USD Million)
                        7.7.3. Argentina
                            7.7.3.1. Key country dynamic
                            7.7.3.2. Regulatory framework
                            7.7.3.3. Competitive insights
                            7.7.3.4. Argentina cancer treatment facilities market estimates and forecasts, 2021 - 2033 (USD Million)
                    7.8. MEA
                        7.8.1. MEA cancer treatment facilities market estimates and forecasts, 2021 - 2033 (USD Million)
                        7.8.2. South Africa
                            7.8.2.1. Key country dynamic
                            7.8.2.2. Regulatory framework
                            7.8.2.3. Competitive insights
                            7.8.2.4. South Africa cancer treatment facilities market estimates and forecasts, 2021 - 2033 (USD Million)
                        7.8.3. Saudi Arabia
                            7.8.3.1. Key country dynamic
                            7.8.3.2. Regulatory framework
                            7.8.3.3. Competitive insights
                            7.8.3.4. Saudi Arabia cancer treatment facilities market estimates and forecasts, 2021 - 2033 (USD Million)
                        7.8.4. UAE
                            7.8.4.1. Key country dynamic
                            7.8.4.2. Regulatory framework
                            7.8.4.3. Competitive insights
                            7.8.4.4. UAE cancer treatment facilities market estimates and forecasts, 2021 - 2033 (USD Million)
                        7.8.5. Kuwait
                            7.8.5.1. Key country dynamic
                            7.8.5.2. Regulatory framework
                            7.8.5.3. Competitive insights
                            7.8.5.4. Kuwait cancer treatment facilities market estimates and forecasts, 2021 - 2033 (USD Million)
Chapter 8. Competitive Landscape
                    8.1. Participant Overview
                    8.2. Company Market Position Analysis
                    8.3. Company Categorization
                    8.4. Strategy Mapping
                    8.5. Company Profiles/Listing
                        8.5.1. Compass Oncology
                            8.5.1.1. Overview
                            8.5.1.2. Financial performance
                            8.5.1.3. Service benchmarking
                            8.5.1.4. Strategic initiatives
                        8.5.2. American Oncology Institute
                            8.5.2.1. Overview
                            8.5.2.2. Financial performance
                            8.5.2.3. Service benchmarking
                            8.5.2.4. Strategic initiatives
                        8.5.3. Mayo Foundation for Medical Education and Research (MFMER)
                            8.5.3.1. Overview
                            8.5.3.2. Financial performance
                            8.5.3.3. Service benchmarking
                            8.5.3.4. Strategic initiatives
                        8.5.4. HCA International Limited
                            8.5.4.1. Overview
                            8.5.4.2. Financial performance
                            8.5.4.3. Service benchmarking
                            8.5.4.4. Strategic initiatives
                        8.5.5. The Royal Marsden
                            8.5.5.1. Overview
                            8.5.5.2. Financial performance
                            8.5.5.3. Service benchmarking
                            8.5.5.4. Strategic initiatives
                        8.5.6. National Cancer Instituteat the National Institutes of Health
                            8.5.6.1. Overview
                            8.5.6.2. Financial performance
                            8.5.6.3. Service benchmarking
                            8.5.6.4. Strategic initiatives
                        8.5.7. Apollo Hospitals Enterprise Ltd.
                            8.5.7.1. Overview
                            8.5.7.2. Financial performance
                            8.5.7.3. Service benchmarking
                            8.5.7.4. Strategic initiatives
                        8.5.8. Kokilaben Dhirubhai Ambani Hospital
                            8.5.8.1. Overview
                            8.5.8.2. Financial performance
                            8.5.8.3. Service benchmarking
                            8.5.8.4. Strategic initiatives
                        8.5.9. HEALTHCARE GLOBAL ENTERPRISES LIMITED
                            8.5.9.1. Overview
                            8.5.9.2. Financial performance
                            8.5.9.3. Service benchmarking
                            8.5.9.4. Strategic initiatives
                        8.5.10. The Johns Hopkins Hospital
                            8.5.10.1. Overview
                            8.5.10.2. Financial performance
                            8.5.10.3. Service benchmarking
                            8.5.10.4. Strategic initiatives
                        8.5.11. Tata Memorial Centre.
                            8.5.11.1. Overview
                            8.5.11.2. Financial performance
                            8.5.11.3. Service benchmarking
                            8.5.11.4. Strategic initiatives

Proceed To Buy

USD 4500
USD 3800
USD 1900
USD 1200

Customization Offered

  • check-img Cross-segment Market Size and Analysis for Mentioned Segments
  • check-imgAdditional Company Profiles (Upto 5 With No Cost)
  • check-img Additional Countries (Apart From Mentioned Countries)
  • check-img Country/Region-specific Report
  • check-img Go To Market Strategy
  • check-imgRegion Specific Market Dynamics
  • check-imgRegion Level Market Share
  • check-img Import Export Analysis
  • check-imgProduction Analysis
  • check-imgOthers