Circulating Tumor Cells Market Size, Share & Trends Analysis Report By Application (Clinical/Liquid Biopsy, Research), By Specimen (Bone Marrow, Blood), By Product, By Technology, By End-use, By Region, And Segment- Global Industry Analysis, Size, Share, Growth, Trends, Regional Outlook, and Forecast 2024-2033

The global circulating tumor cells market size reached USD 11.59 billion in 2023 and is projected to hit around USD 41.59 billion by 2033, expanding at a CAGR of 13.63% during the forecast period from 2024 to 2033.
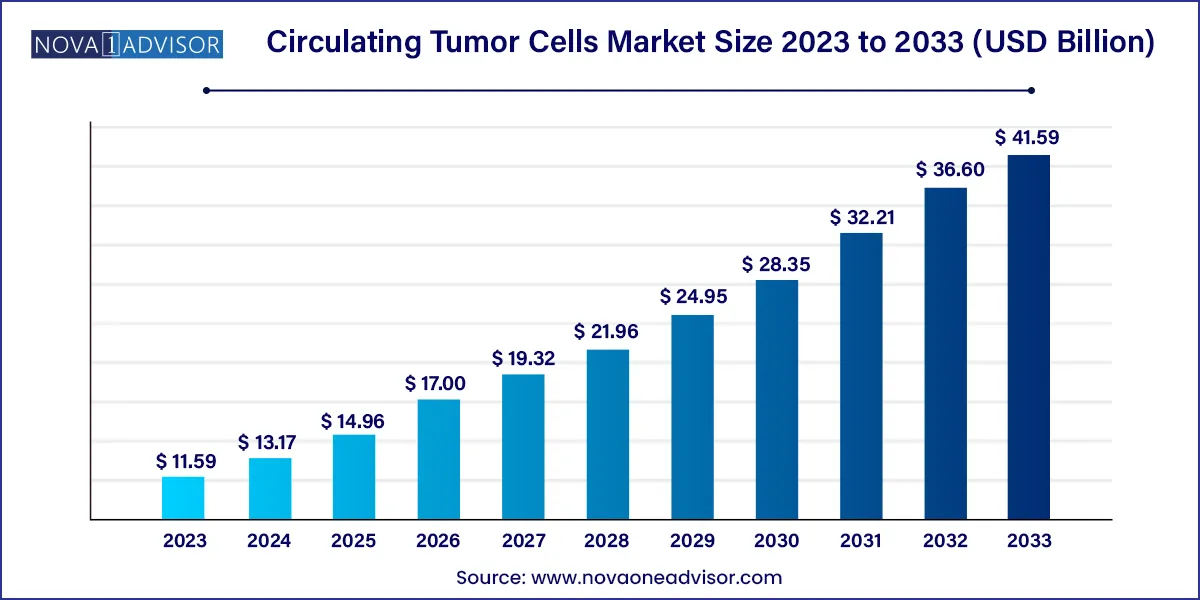
Circulating Tumor Cells Market Size, 2024 to 2033

Key Takeaways:

  • North America captured the largest revenue share of 43% in 2023.
  • Asia Pacific is projected to grow at a lucrative CAGR during the forecast period
  • In 2023, the CTC detection and enrichment methods segment accounted for the largest revenue share of 66.29%.
  • The CTC analysis segment is expected to register the fastest CAGR from 2024 to 2033.
  • The research segment dominated the market and captured the largest revenue share in 2023.
  • Clinical/ liquid biopsy is expected to register a significant CAGR from 2024 to 2033.
  • The kits & reagents segment dominated the market and accounted for the largest revenue share of 2023.
  • The devices or systems segment is expected to showcase significant CAGR during the forecast period.
  • The research and academic institutes segment accounted for the largest revenue share of 2023.
  • The diagnostic centers segment is expected to register a significant CAGR from 2024 to 2033.
  • The blood specimen segment dominated the market and accounted for the largest revenue share in 2023.
  • The bone marrow segment is expected to register a significant CAGR during the forecast period.

Circulating Tumor Cells Market Overview

The Circulating Tumor Cells (CTCs) market presents a transformative landscape in the realm of cancer diagnostics and monitoring. CTCs are cancer cells that break away from the primary tumor and circulate in the bloodstream, holding immense potential for revolutionizing how we detect, characterize, and manage cancer. This overview explores the key facets of the Circulating Tumor Cells market, highlighting its significance, drivers, challenges, and the technological innovations shaping its trajectory.

Circulating Tumor Cells Market Growth

The non-invasiveness and advantages offered by circulating tumor cells (CTC), it is considered a promising tool in cancer diagnosis. This is anticipated to contribute to the market’s growth. Technological advancements in chip technology is another key factor driving the growth. the ongoing advancements in chip technology have positively impacted market growth. Cluster chip technology plays a key role in capturing the exceptionally rare group of cells, such as CTCs. Isolation of CTCs is a cumbersome process and requires high accuracy. The chip technology not only helps perform precise CTC isolation but also helps overcome the challenges associated with isolation devices developed by key companies. The challenges include lower sensitivity, the inability to capture CTCs of all sizes & types, high manufacturing costs, and difficulty in retrieving captured CTCs from the devices for further laboratory analysis. Moreover, the white blood cells that contaminate trapped CTCs, which are similar in size, can be mistakenly regarded as CTCs; this is a limitation associated with these devices.

Increasing global prevalence of cancer is one of the major drivers for growth of the CTC market. In 2023, the Pan American Health Organization reported around 20 million newly diagnosed cancer cases and 10 million cancer-related deaths. Projections indicate a probable 60% surge in cancer burden over the next two decades, posing additional challenges to healthcare systems, individuals, and communities. It is anticipated that the global incidence of new cancer cases expected rise to approximately 30 million by the year 2040.

In addition, circulating tumor cells in breast cancer diagnosis are released in the bloodstream by cancerous tumors. As per the Breast Cancer Statistics and Resources, it is anticipated that in 2023, around 297,790 women might be diagnosed of breast cancer in the U.S., solidifying its status as the most prevalent cancer among American women. The rising burden of cancer also attracts increased investment in research and development for new cancer therapies & technologies. CTCs that actively participate in clinical trials and adopt innovative treatment options can attract patients seeking access to cutting-edge care, further boosting their market position.

Circulating Tumor Cells Market Report Scope

Report Attribute Details
Market Size in 2024 USD 13.17 Billion
Market Size by 2033 USD 41.59 Billion
Growth Rate From 2024 to 2033 CAGR of 13.63%
Base Year 2023
Forecast Period 2024 to 2033
Segments Covered Technology, application, product, specimen, end-use, region
Market Analysis (Terms Used) Value (US$ Million/Billion) or (Volume/Units)
Report Coverage Revenue forecast, company ranking, competitive landscape, growth factors, and trends
Key Companies Profiled QIAGEN; Bio-Techne Corp.; Precision for Medicine; AVIVA Biosciences; BIOCEPT, Inc.; BioCEP Ltd.; Fluxion Biosciences, Inc.; Greiner Bio-One International GmbH; Ikonisys, Inc.; Miltenyi Biotec; IVDiagnostics; BioFluidica; Canopus Bioscience Ltd.; Biolidics Limited; Creativ MicroTech, Inc.; LungLife AI, Inc.; Epic Sciences; Rarecells Diagnostics; ScreenCell; Menarini Silicon Biosystems; LineaRx, Inc. (Vitatex, Inc.); Sysmex Corporation; STEMCELL Technologies, Inc.


Key Factors Driving the Circulating Tumor Cells Market:

  • Non-Invasive Diagnostics: CTCs enable non-invasive liquid biopsies, offering a less invasive alternative to traditional tissue biopsies for cancer diagnosis.
  • Precision Medicine Adoption: The use of CTCs provides real-time insights into the genetic and molecular characteristics of tumors, supporting the trend towards precision medicine and personalized treatment plans.
  • Early Cancer Detection: CTCs offer the potential for early detection of cancer, facilitating timely intervention and improved patient outcomes.
  • Treatment Monitoring: CTCs allow for real-time monitoring of treatment responses, assisting clinicians in evaluating the effectiveness of therapies and making timely adjustments.
  • Technological Advancements: Ongoing advancements in technologies like microfluidics and molecular analysis enhance the sensitivity and accuracy of CTC detection methods, driving the development of more reliable diagnostic tools.
  • Increasing Cancer Incidence: The rising global incidence of cancer contributes to the growing demand for advanced diagnostic methods, with CTCs addressing the need for comprehensive information in cancer management.
  • Research Applications: CTCs play a crucial role in cancer research by enabling the study of tumor heterogeneity, metastasis, and other aspects, expanding their applications in both research and clinical settings.
  • Prognostic Potential: CTCs have the potential to serve as prognostic indicators, helping predict disease progression and recurrence and guiding treatment decisions.
  • Collaborations and Investments: Collaborations between academic institutions, biotechnology companies, and healthcare providers foster research and development efforts, leading to the refinement and commercialization of innovative CTC-based diagnostic solutions.
  • Clinical Utility: Growing recognition of the clinical utility of CTCs in guiding treatment decisions, especially in monitoring minimal residual disease and predicting response to therapy.

Segments Insights:

Technology Insights

In 2023, the CTC detection and enrichment methods segment accounted for the largest revenue share of 66.29%. The availability of different methods for the enrichment of circulating tumor cells in cancer detection is expected to significantly impact segment growth over the forecast period. Moreover, positive or negative enrichment of CTCs based on biological properties is expected to hold significant potential for market growth. An effective enrichment process helps in the enhancement of sensitivity, selectivity, and yield, thereby ensuring successful clinical translation of this field. Different techniques for CTC detection include magnetic beads-based centrifugal force, enrichment, filtration, and other physical properties such as density, deformity, size, & electric charges.

The CTC analysis segment is expected to register the fastest CAGR from 2024 to 2033. Understanding subclonal intratumor heterogeneity using CTC detection can help clinicians in determining the underlying reasons for unresponsive patients subjected to targeted therapy, eventually leading to enhanced cancer therapies. Hence, CTC analysis is a minimally invasive method in repetitive analysis and validated technology for tumor study & clinical decision making. Technological advancements such as immunofluorescence, Next-Generation Sequencing (NGS), Fluorescence In Situ Hybridization (FISH), and quantitative PCR (qPCR) are anticipated to improve CTC analyses. Hence, due to the presence of fundamental principle of amplification in qPCR, the detection of CTCs in a large blood sample becomes efficient and accurate.

Application Insights

The research segment dominated the market and captured the largest revenue share in 2023. CTCs are regarded as a substrate of cancer metastasis. Currently, the enumeration of CTCs represents an effective predictive and prognostic biomarker capable of monitoring the efficacy of adjuvant therapies, identifying early development of metastases, and evaluating therapeutic responses better than conventional imaging methods. In addition, CTC enumeration remains largely a research tool.

Recently, the focus has shifted toward CTC characterization and isolation, which can provide significant opportunities in predictive testing research. For instance, in April 2021, Bio-Techne Corporation acquired Asuragen, Inc. for USD 215 million. Asuragen’s expertise in productizing lab-developed tests and commercializing innovative molecular products allowed Bio-Techne to offer advanced solutions to researchers and clinicians.

Clinical/ liquid biopsy is expected to register a significant CAGR from 2024 to 2033. In a liquid biopsy, the analysis CTCs in a cancer patient’s bloodstream has received significant attention for their potential clinical utility. The number of CTCs in a patient’s blood can differ based on cancer type, stage, and treatment. The number of CTCs found in the patient’s bloodstream indicates the state of the disease. Patients in the later stages of cancer show a higher number of CTCs than patients in early stages of cancer.

Product Insights

The kits & reagents segment dominated the market and accounted for the largest revenue share of 2023. This can be attributed to frequent purchases and high usage rates. For instance, CellSearch Circulating Tumour Cell Kit authorized by the U.S. FDA, is one the most popular products produced in the U.S. Additionally, the availability of a robust product portfolio coupled with advancements in microfluidics technology is expected to propel the market growth.

The devices or systems segment is expected to showcase significant CAGR during the forecast period. The introduction of fabricated glass microchips to overcome the challenges and to increase technical completeness for mass production is expected to propel the segment growth. The development of automated instruments that eliminate the use of additional blood collection tubes reduces the cost of blood collection tubes.

The reduction in costs is also observed as the transportation is free of the additional laboratory consumables and transfer tubes when the reagent-equipped tubes are used. On the other hand, kits and reagents have also contributed significantly to the segment’s revenue.

End-use Insights

The research and academic institutes segment accounted for the largest revenue share of 2023. This can be attributed to the increasing focus on research and development activities for cancer diagnosis and treatment. These institutes are investing heavily in advanced technologies and equipment to enhance the accuracy and efficiency of circulating tumor cell detection and analysis.

The diagnostic centers segment is expected to register a significant CAGR from 2024 to 2033. This is due to their advanced technology and expertise in detecting and analyzing CTCs. They have access to advanced equipment and trained professionals who can perform accurate and reliable tests. Additionally, diagnostic centers have partnerships with hospitals and healthcare providers, which gives them a larger customer base and more opportunities to expand their services. These factors have contributed to their success in the CTC market.

Specimen Insights

The blood specimen segment dominated the market and accounted for the largest revenue share in 2023. A large concentration of these cells in blood samples as compared with other biospecimens is responsible for the largest penetration of this specimen type. Approaches for tumor cell identification in blood samples are considered important in current cancer research, as it aids in the prediction of prognosis and determination of the response to systemic chemotherapy. However, the use of whole blood as a specimen poses a challenge when combined with microfluidic technology.

The bone marrow segment is expected to register a significant CAGR during the forecast period. Bone marrow samples, when analyzed for CTCs, play a vital role in cancer research and clinical trials. Researchers use these samples to study the biology of circulating tumor cells, understand the mechanisms of metastasis, and develop novel therapeutic approaches. These factors are expected to support segment growth in the forecast years.

Regional Insights

North America captured the largest revenue share of 43% in 2023. Aviva Biosciences; Apocell, Inc.; Advanced Cell Diagnostics; Biocept, Inc.; Biofluidica, Inc.; and CellTraffix, Inc. are the key players operating in the region. These players are undertaking various strategies to enhance their market hold, which is a key factor responsible for the high share of the U.S. market for circulating tumor cells.
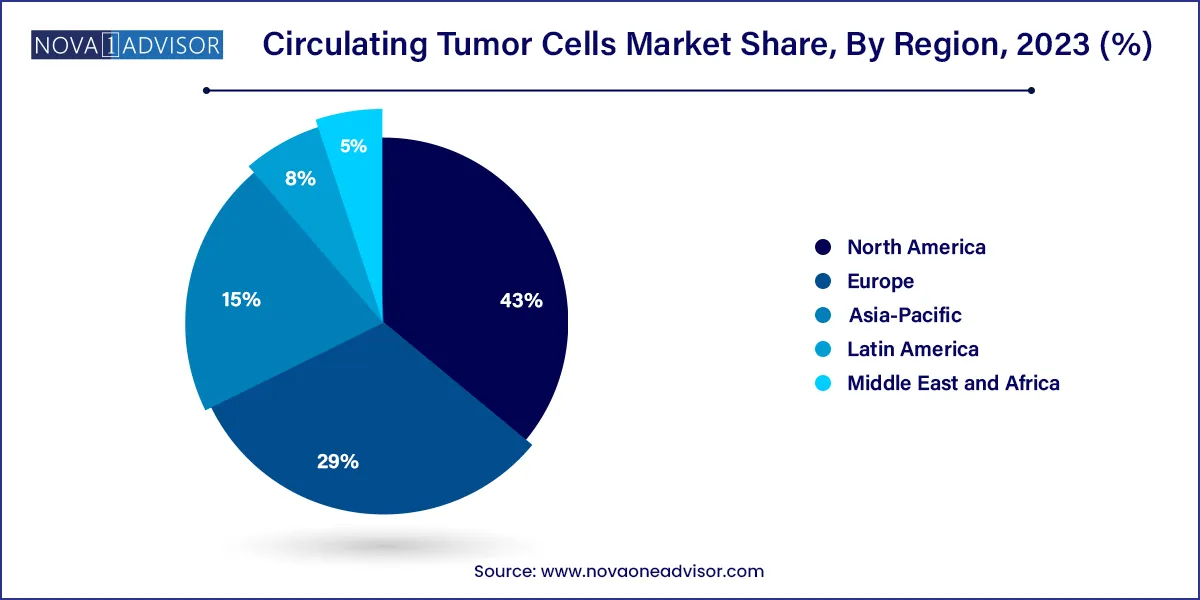
Circulating Tumor Cells Market Share, By Region, 2023 (%)

The U.S. is anticipated to significantly contribute to the regional market's growth due to factors including the rising incidence of cancer, product approvals, and increased R&D efforts. For instance, the American Cancer Society projects that there approximately 127,070 lung cancer fatalities nationwide and about 238,340 new instances of lung cancer diagnosis in 2023. Furthermore, the presence of a population with high susceptibility to cancer, an increase in market penetration rates, and technologically advanced cancer care infrastructure are supporting the region’s growth.

Asia Pacific is projected to grow at a lucrative CAGR during the forecast period, due to high unmet diagnostic needs coupled with rapidly growing awareness with regard to early detection of cancer and risk assessment. China is a major country that drives the regional market growth. The economy of China developed its infrastructure with academic and research institutes that provide knowledge and create interest in the emerging fields of diagnostics, biotechnology, & genetics. It also created facilities to support their development by adopting the latest technologies. The competitive nature of the government, leading to high investments in emerging fields of research, is anticipated to boost revenue generation over the forecast period.

Recent Developments

  • In August 2023, Cell Microsystems acquired Fluxion Biosciences, Inc. This acquisition enabled precise measurement of electrical currents across cell membranes, providing insights into ion channel activity and cell signaling.
  • In June 2023, Bio-Techne announced the acquisition of LunaPhore, a Swiss company developing advanced technologies for tissue imaging and analysis. By integrating LunaPhore's expertise into its existing portfolio, Bio-Techne aimed to create a comprehensive, end-to-end workflow for researchers studying tissues. The acquisition is expected to close in the first quarter of 2024.
  • In May 2023, Menarini Silicon Biosystems partnered with Alivio Health to provide access to its CELLSEARCH liquid biopsy tests for Alivio Health's clients and members. CELLSEARCH tests provide noninvasive analysis of CTCs to help in clinical decision-making, potentially leading to earlier diagnosis and more effective treatment strategies.
  • In March 2023, Miltenyi Biotec acquired Lino Biotech AG. This acquisition of Lino Biotech's innovative biosensor technology was expected to help in the development of new & improved assays and quality control processes in the field.

Key Circulating Tumor Cells Companies:

The following are the leading companies in the circulating tumor cells market. These companies collectively hold the largest market share and dictate industry trends. Financials, strategy maps & products of these CTC companies are analyzed to map the supply network.

  • QIAGEN
  • Bio-Techne Corporation
  • Precision for Medicine
  • AVIVA Biosciences
  • BIOCEPT, Inc.
  • BioCEP Ltd.
  • Fluxion Biosciences, Inc.
  • Greiner Bio-One International GmbH
  • Ikonisys, Inc.
  • Miltenyi Biotec
  • IVDiagnostics, Inc.
  • BioFluidica
  • Canopus Bioscience Ltd.
  • Biolidics Limited
  • Creativ MicroTech, Inc.
  • LungLife AI, Inc.
  • Epic Sciences
  • Rarecells Diagnostics
  • ScreenCell
  • Menarini Silicon Biosystems
  • LineaRx, Inc. (Vitatex, Inc.)
  • Sysmex Corporation
  • STEMCELL Technologies, Inc.

Segments Covered in the Report

This report forecasts revenue growth at country levels and provides an analysis of the latest industry trends in each of the sub-segments from 2021 to 2033. For this study, Nova one advisor, Inc. has segmented the Circulating Tumor Cells market.

By Technology 

  • CTC Detection & Enrichment Methods
    • Immunocapture (Label-based)
      • Positive Selection
      • Negative Selection
    • Size-based Separation (Label-free)
      • Membrane-based
      • Microfluidic-based
    • Density-based Separation (Label-free)
    • Combined Methods
  • CTC Direct Detection Methods
    • SERS
    • Microscopy
    • Others
  • CTC Analysis

By Application 

  • Clinical/ Liquid Biopsy
    • Risk Assessment
    • Screening and Monitoring
  • Research
    • Cancer Stem Cell & Tumorogenesis Research
    • Drug/Therapy Development

By Product 

  • Kits & Reagents
  • Blood Collection Tubes
  • Devices or Systems

By Specimen 

  • Blood
  • Bone Marrow
  • Other Body Fluids

By End-use 

  • Research and Academic Institutes
  • Hospital and Clinics
  • Diagnostic Centers

By Region

  • North America
  • Europe
  • Asia-Pacific
  • Latin America
  • Middle East & Africa (MEA)

Frequently Asked Questions

The global circulating tumor cells market size reached USD 11.59 billion in 2023 and is projected to hit around USD 41.59 billion by 2033

The global circulating tumor cells market is expected to grow at a compound annual growth rate of 13.623% from 2024 to 2033

Some key players operating in the CTCs market include QIAGEN, Bio-Techne Corporation, BIOCEPT, Inc., Greiner Bio One International GmbH, Miltenyi Biotec, Biolidics Limited, Creatv MicroTech, Inc. and among others.

Chapter 1. Circulating Tumor Cells Market: Methodology and Scope
                   1.1. Market Segmentation & Scope
                   1.2. Segment Definitions
                       1.2.1. Technology
                       1.2.2. Application
                       1.2.3. Product
                       1.2.4. Specimen
                       1.2.5. End-use
                   1.3. Research Methodology
                   1.4. Information Procurement
                       1.4.1. Purchased database
                       1.4.2. nova one advisor’s internal database
                       1.4.3. Secondary sources
                       1.4.4. Primary research
                       1.4.5. Details of primary research
                   1.5. Information or Data Analysis
                       1.5.1. Data analysis models
                   1.6. Market Formulation & Validation
                   1.7. Model Details
                       1.7.1. Commodity flow analysis (Model 1)
                       1.7.2. Approach 1: Commodity flow approach
                       1.7.3. Volume price analysis (Model 2)
                       1.7.4. Approach 2: Volume price analysis
                   1.8. List of Secondary Sources
                   1.9. List of Primary Sources
                   1.10. Objectives
Chapter 2. Circulating Tumor Cells Market: Executive Summary
                   2.1. Market Outlook
                   2.2. Segment Snapshot
                   2.3. Competitive Insights
Chapter 3. Circulating Tumor Cells Market: Variables, Trends & Scope
                   3.1. Market Lineage Outlook
                       3.1.1. Parent market outlook
                       3.1.2. Related/ancillary market outlook
                   3.2. Market Dynamics
                       3.2.1. Market driver analysis
                           3.2.1.1. Advancements in chip technology
                           3.2.1.2. Expanding applications of CTCs
                           3.2.1.3. Growing demand for early and rapid cancer diagnosis
                           3.2.1.4. Growing incidence of cancer
                       3.2.2. Market restraint analysis
                           3.2.2.1. Consistency-related challenges in CTC detection and enrichment
                           3.2.2.2. Higher preference for Point-of-Care (POC) testing and nonavailability of POC adaptable CTC tests
                           3.2.2.3. Lower applicability of CTCs in rare cancers
                   3.3. Circulating Tumor Cells Market Analysis Tools
                       3.3.1. Industry Analysis - Porter’s
                       3.3.2. PESTEL Analysis
                       3.3.3. COVID-19 Impact Analysis
Chapter 4. Circulating Tumor Cells Market: Technology Estimates & Trend Analysis
                   4.1. Technology Market Share, 2024 - 2033
                   4.2. Global Circulating Tumor Cells Market by Technology Outlook
                   4.3. Market Size & Forecasts and Trend Analyses, 2018 to 2030 for the following
                       4.3.1. CTC Detection & Enrichment Methods
                           4.3.1.1. Market estimates and forecasts, 2021 - 2033
                           4.3.1.2. Immunocapture (Label-based)
                               4.3.1.2.1. Market estimates and forecasts, 2021 - 2033
                               4.3.1.2.2. Positive Selection
                                   4.3.1.2.2.1. Market estimates and forecasts, 2021 - 2033
                               4.3.1.2.3. Negative Selection
                                   4.3.1.2.3.1. Market estimates and forecasts, 2021 - 2033
                           4.3.1.3. Size-based Separation (Label-free)
                               4.3.1.3.1. Market estimates and forecasts, 2021 - 2033
                               4.3.1.3.2. Membrane-based
                                   4.3.1.3.2.1. Market estimates and forecasts, 2021 - 2033
                               4.3.1.3.3. Microfluidic-based
                                   4.3.1.3.3.1. Market estimates and forecasts, 2021 - 2033
                           4.3.1.4. Density-based Separation (Label-free)
                               4.3.1.4.1. Market estimates and forecasts, 2021 - 2033
                           4.3.1.5. Combined Methods
                               4.3.1.5.1. Market estimates and forecasts, 2021 - 2033
                       4.3.2. CTC Direct Detection Methods
                           4.3.2.1. Market estimates and forecasts, 2021 - 2033
                           4.3.2.2. SERS
                               4.3.2.2.1. Market estimates and forecasts, 2021 - 2033
                           4.3.2.3. Microscopy
                               4.3.2.3.1. Market estimates and forecasts, 2021 - 2033
                           4.3.2.4. Others
                               4.3.2.4.1. Market estimates and forecasts, 2021 - 2033
                       4.3.3. CTC Analysis
                           4.3.3.1. Market estimates and forecasts, 2021 - 2033
Chapter 5. Circulating Tumor Cells Market: Application Estimates & Trend Analysis
                   5.1. Application Market Share, 2024 - 2033
                   5.2. Global Circulating Tumor Cells Market by Application Outlook
                   5.3. Market Size & Forecasts and Trend Analyses, 2018 to 2030 for the following
                       5.3.1. Clinical/ Liquid Biopsy
                           5.3.1.1. Market estimates and forecasts, 2021 - 2033
                           5.3.1.2. Risk Assessment
                               5.3.1.2.1. Market estimates and forecasts, 2021 - 2033
                           5.3.1.3. Screening and Monitoring
                               5.3.1.3.1. Market estimates and forecasts, 2021 - 2033
                       5.3.2. Research
                           5.3.2.1. Market estimates and forecasts, 2021 - 2033
                           5.3.2.2. Cancer Stem Cell & Tumorogenesis Research
                               5.3.2.2.1. Market estimates and forecasts, 2021 - 2033
                           5.3.2.3. Drug/Therapy Development
                               5.3.2.3.1. Market estimates and forecasts, 2021 - 2033
Chapter 6. Circulating Tumor Cells Market: Product Estimates & Trend Analysis
                   6.1. Product Market Share, 2024 - 2033
                   6.2. Global Circulating Tumor Cells Market by Product Outlook
                   6.3. Market Size & Forecasts and Trend Analyses, 2018 to 2030 for the following
                       6.3.1. Kits & reagents
                           6.3.1.1. Market estimates and forecasts, 2021 - 2033
                       6.3.2. Blood collection tubes
                           6.3.2.1. Market estimates and forecasts, 2021 - 2033
                       6.3.3. Devices or systems
                           6.3.3.1. Market estimates and forecasts, 2021 - 2033
Chapter 7. Circulating Tumor Cells Market: Specimen Estimates & Trend Analysis
                   7.1. Specimen Market Share, 2024 - 2033
                   7.2. Global Circulating Tumor Cells Market by Specimen Outlook
                   7.3. Market Size & Forecasts and Trend Analyses, 2018 to 2030 for the following
                       7.3.1. Blood
                           7.3.1.1. Market estimates and forecasts, 2021 - 2033
                       7.3.2. Bone marrow
                           7.3.2.1. Market estimates and forecasts, 2021 - 2033
                       7.3.3. Other body fluids
                           7.3.3.1. Market estimates and forecasts, 2021 - 2033
Chapter 8. Circulating Tumor Cells Market: End-use Estimates & Trend Analysis
                   8.1. End-use Market Share, 2024 - 2033
                   8.2. Global Circulating Tumor Cells Market by End-use Outlook
                   8.3. Market Size & Forecasts and Trend Analyses, 2018 to 2030 for the following
                       8.3.1. Research and academic institutes
                           8.3.1.1. Market estimates and forecasts, 2021 - 2033
                       8.3.2. Hospital and clinics
                           8.3.2.1. Market estimates and forecasts, 2021 - 2033
                       8.3.3. Diagnostic centers
                           8.3.3.1. Market estimates and forecasts, 2021 - 2033
Chapter 9. Circulating Tumor Cells Market: Regional Estimates & Trend Analysis
                   9.1. Regional Market Share Analysis, 2024 - 2033
                   9.2. North America
                       9.2.1. North America market estimates and forecasts, 2021 - 2033
                       9.2.2. U.S.
                           9.2.2.1. Key country dynamics
                           9.2.2.2. Regulatory framework
                           9.2.2.3. Competitive scenario
                           9.2.2.4. U.S. market estimates and forecasts, 2021 - 2033
                           9.2.2.5. Target disease prevalence
                       9.2.3. Canada
                           9.2.3.1. Key country dynamics
                           9.2.3.2. Regulatory framework
                           9.2.3.3. Competitive scenario
                           9.2.3.4. Canada market estimates and forecasts, 2021 - 2033
                           9.2.3.5. Target disease prevalence
                   9.3. Europe
                       9.3.1. Europe market estimates and forecasts, 2021 - 2033
                       9.3.2. UK
                           9.3.2.1. Key country dynamics
                           9.3.2.2. Regulatory framework
                           9.3.2.3. Competitive scenario
                           9.3.2.4. UK market estimates and forecasts, 2021 - 2033
                           9.3.2.5. Target disease prevalence
                       9.3.3. Germany
                           9.3.3.1. Key country dynamics
                           9.3.3.2. Regulatory framework
                           9.3.3.3. Competitive scenario
                           9.3.3.4. Germany market estimates and forecasts, 2021 - 2033
                           9.3.3.5. Target disease prevalence
                       9.3.4. France
                           9.3.4.1. Key country dynamics
                           9.3.4.2. Regulatory framework
                           9.3.4.3. Competitive scenario
                           9.3.4.4. France market estimates and forecasts, 2021 - 2033
                           9.3.4.5. Target disease prevalence
                       9.3.5. Italy
                           9.3.5.1. Key country dynamics
                           9.3.5.2. Regulatory framework
                           9.3.5.3. Competitive scenario
                           9.3.5.4. Italy market estimates and forecasts, 2021 - 2033
                           9.3.5.5. Target disease prevalence
                       9.3.6. Spain
                           9.3.6.1. Key country dynamics
                           9.3.6.2. Regulatory framework
                           9.3.6.3. Competitive scenario
                           9.3.6.4. Spain market estimates and forecasts, 2021 - 2033
                           9.3.6.5. Target disease prevalence
                       9.3.7. Norway
                           9.3.7.1. Key country dynamics
                           9.3.7.2. Regulatory framework
                           9.3.7.3. Competitive scenario
                           9.3.7.4. Norway market estimates and forecasts, 2021 - 2033
                           9.3.7.5. Target disease prevalence
                       9.3.8. Sweden
                           9.3.8.1. Key country dynamics
                           9.3.8.2. Regulatory framework
                           9.3.8.3. Competitive scenario
                           9.3.8.4. Sweden market estimates and forecasts, 2021 - 2033
                           9.3.8.5. Target disease prevalence
                       9.3.9. Denmark
                           9.3.9.1. Key country dynamics
                           9.3.9.2. Regulatory framework
                           9.3.9.3. Competitive scenario
                           9.3.9.4. Denmark market estimates and forecasts, 2021 - 2033
                           9.3.9.5. Target disease prevalence
                   9.4. Asia Pacific
                       9.4.1. Asia Pacific market estimates and forecasts, 2021 - 2033
                       9.4.2. Japan
                           9.4.2.1. Key country dynamics
                           9.4.2.2. Regulatory framework
                           9.4.2.3. Competitive scenario
                           9.4.2.4. Japan market estimates and forecasts, 2021 - 2033
                           9.4.2.5. Target disease prevalence
                       9.4.3. China
                           9.4.3.1. Key country dynamics
                           9.4.3.2. Regulatory framework
                           9.4.3.3. Competitive scenario
                           9.4.3.4. China market estimates and forecasts, 2021 - 2033
                           9.4.3.5. Target disease prevalence
                       9.4.4. India
                           9.4.4.1. Key country dynamics
                           9.4.4.2. Regulatory framework
                           9.4.4.3. Competitive scenario
                           9.4.4.4. India market estimates and forecasts, 2021 - 2033
                           9.4.4.5. Target disease prevalence
                       9.4.5. Australia
                           9.4.5.1. Key country dynamics
                           9.4.5.2. Regulatory framework
                           9.4.5.3. Competitive scenario
                           9.4.5.4. Australia market estimates and forecasts, 2021 - 2033
                           9.4.5.5. Target disease prevalence
                       9.4.6. South Korea
                           9.4.6.1. Key country dynamics
                           9.4.6.2. Regulatory framework
                           9.4.6.3. Competitive scenario
                           9.4.6.4. South Korea market estimates and forecasts, 2021 - 2033
                           9.4.6.5. Target disease prevalence
                       9.4.7. Thailand
                           9.4.7.1. Key country dynamics
                           9.4.7.2. Regulatory framework
                           9.4.7.3. Competitive scenario
                           9.4.7.4. Thailand market estimates and forecasts, 2021 - 2033
                           9.4.7.5. Target disease prevalence
                   9.5. Latin America
                       9.5.1. Latin America market estimates and forecasts, 2021 - 2033
                       9.5.2. Brazil
                           9.5.2.1. Key country dynamics
                           9.5.2.2. Regulatory framework
                           9.5.2.3. Competitive scenario
                           9.5.2.4. Brazil market estimates and forecasts, 2021 - 2033
                           9.5.2.5. Target disease prevalence
                       9.5.3. Mexico
                           9.5.3.1. Key country dynamics
                           9.5.3.2. Regulatory framework
                           9.5.3.3. Competitive scenario
                           9.5.3.4. Mexico market estimates and forecasts, 2021 - 2033
                           9.5.3.5. Target disease prevalence
                       9.5.4. Argentina
                           9.5.4.1. Key country dynamics
                           9.5.4.2. Regulatory framework
                           9.5.4.3. Competitive scenario
                           9.5.4.4. Argentina market estimates and forecasts, 2021 - 2033
                           9.5.4.5. Target disease prevalence
                   9.6. MEA
                       9.6.1. MEA market estimates and forecasts, 2021 - 2033
                       9.6.2. South Africa
                           9.6.2.1. Key country dynamics
                           9.6.2.2. Regulatory framework
                           9.6.2.3. Competitive scenario
                           9.6.2.4. South Africa market estimates and forecasts, 2021 - 2033
                           9.6.2.5. Target disease prevalence
                       9.6.3. Saudi Arabia
                           9.6.3.1. Key country dynamics
                           9.6.3.2. Regulatory framework
                           9.6.3.3. Competitive scenario
                           9.6.3.4. Saudi Arabia market estimates and forecasts, 2021 - 2033
                           9.6.3.5. Target disease prevalence
                       9.6.4. UAE
                           9.6.4.1. Key country dynamics
                           9.6.4.2. Regulatory framework
                           9.6.4.3. Competitive scenario
                           9.6.4.4. UAE market estimates and forecasts, 2021 - 2033
                           9.6.4.5. Target disease prevalence
                       9.6.5. Kuwait
                           9.6.5.1. Key country dynamics
                           9.6.5.2. Regulatory framework
                           9.6.5.3. Competitive scenario
                           9.6.5.4. Kuwait market estimates and forecasts, 2021 - 2033
                           9.6.5.5. Target disease prevalence
Chapter 10. Competitive Landscape
                   10.1. Recent Developments & Impact Analysis, By Key Market Participants
                   10.2. Company/Competition Categorization
                   10.3. Vendor Landscape
                       10.3.1. List of key distributors and channel partners
                       10.3.2. Key customers
                       10.3.3. Key company position analysis, 2023
                   10.4. Company Profiles
                       10.4.1. QIAGEN
                           10.4.1.1. Company overview
                           10.4.1.2. Financial performance
                           10.4.1.3. Product benchmarking
                           10.4.1.4. Strategic initiatives
                       10.4.2. Bio-Techne Corp.
                           10.4.2.1. Company overview
                           10.4.2.2. Financial performance
                           10.4.2.3. Product benchmarking
                           10.4.2.4. Strategic initiatives
                       10.4.3. Precision for Medicine
                           10.4.3.1. Company overview
                           10.4.3.2. Financial performance
                           10.4.3.3. Product benchmarking
                           10.4.3.4. Strategic initiatives
                       10.4.4. AVIVA Biosciences
                           10.4.4.1. Company overview
                           10.4.4.2. Financial performance
                           10.4.4.3. Product benchmarking
                           10.4.4.4. Strategic initiatives
                       10.4.5. BIOCEPT, Inc.
                           10.4.5.1. Company overview
                           10.4.5.2. Financial performance
                           10.4.5.3. Product benchmarking
                           10.4.5.4. Strategic initiatives
                       10.4.6. BioCEP Ltd.
                           10.4.6.1. Company overview
                           10.4.6.2. Financial performance
                           10.4.6.3. Product benchmarking
                           10.4.6.4. Strategic initiatives
                       10.4.7. Fluxion Biosciences, Inc.
                           10.4.7.1. Company overview
                           10.4.7.2. Financial performance
                           10.4.7.3. Product benchmarking
                           10.4.7.4. Strategic initiatives
                       10.4.8. Greiner Bio-One International GmbH
                           10.4.8.1. Company overview
                           10.4.8.2. Financial performance
                           10.4.8.3. Product benchmarking
                           10.4.8.4. Strategic initiatives
                       10.4.9. Ikonisys, Inc.
                           10.4.9.1. Company overview
                           10.4.9.2. Financial performance
                           10.4.9.3. Product benchmarking
                           10.4.9.4. Strategic initiatives
                       10.4.10. Miltenyi Biotec
                           10.4.10.1. Company overview
                           10.4.10.2. Financial performance
                           10.4.10.3. Product benchmarking
                           10.4.10.4. Strategic initiatives
                       10.4.11. IVDiagnostics
                           10.4.11.1. Company overview
                           10.4.11.2. Financial performance
                           10.4.11.3. Product benchmarking
                           10.4.11.4. Strategic initiatives
                       10.4.12. BioFluidica
                           10.4.12.1. Company overview
                           10.4.12.2. Financial performance
                           10.4.12.3. Product benchmarking
                           10.4.12.4. Strategic initiatives
                       10.4.13. Canopus Bioscience Ltd.
                           10.4.13.1. Company overview
                           10.4.13.2. Financial performance
                           10.4.13.3. Product benchmarking
                           10.4.13.4. Strategic initiatives
                       10.4.14. Biolidics Limited
                           10.4.14.1. Company overview
                           10.4.14.2. Financial performance
                           10.4.14.3. Product benchmarking
                           10.4.14.4. Strategic initiatives
                       10.4.15. Creativ MicroTech , Inc.
                           10.4.15.1. Company overview
                           10.4.15.2. Financial performance
                           10.4.15.3. Product benchmarking
                           10.4.15.4. Strategic initiatives
                       10.4.16. LungLife AI
                           10.4.16.1. Company overview
                           10.4.16.2. Financial performance
                           10.4.16.3. Product benchmarking
                           10.4.16.4. Strategic initiatives
                       10.4.17. Epic Sciences
                           10.4.17.1. Company overview
                           10.4.17.2. Financial performance
                           10.4.17.3. Product benchmarking
                           10.4.17.4. Strategic initiatives
                       10.4.18. Rarecells Diagnostics
                           10.4.18.1. Company overview
                           10.4.18.2. Financial performance
                           10.4.18.3. Product benchmarking
                           10.4.18.4. Strategic initiatives
                       10.4.19. ScreenCell
                           10.4.19.1. Company overview
                           10.4.19.2. Financial performance
                           10.4.19.3. Product benchmarking
                           10.4.19.4. Strategic initiatives
                       10.4.20. Menarini Silicon Biosystems
                           10.4.20.1. Company overview
                           10.4.20.2. Financial performance
                           10.4.20.3. Product benchmarking
                           10.4.20.4. Strategic initiatives
                       10.4.21. LineaRx, Inc. (Vitatex, Inc.)
                           10.4.21.1. Company overview
                           10.4.21.2. Financial performance
                           10.4.21.3. Product benchmarking
                           10.4.21.4. Strategic initiatives
                       10.4.22. Sysmex Corporation
                           10.4.22.1. Company overview
                           10.4.22.2. Financial performance
                           10.4.22.3. Product benchmarking
                           10.4.22.4. Strategic initiatives
                       10.4.23. STEMCELL Technologies, Inc.
                           10.4.23.1. Company overview
                           10.4.23.2. Financial performance
                           10.4.23.3. Product benchmarking
                           10.4.23.4. Strategic initiatives

Proceed To Buy

USD 4500
USD 3900
USD 1900
USD 1200

Customization Offered

  • check-img Cross-segment Market Size and Analysis for Mentioned Segments
  • check-imgAdditional Company Profiles (Upto 5 With No Cost)
  • check-img Additional Countries (Apart From Mentioned Countries)
  • check-img Country/Region-specific Report
  • check-img Go To Market Strategy
  • check-imgRegion Specific Market Dynamics
  • check-imgRegion Level Market Share
  • check-img Import Export Analysis
  • check-imgProduction Analysis
  • check-imgOthers