Commercial Greenhouse Market (By Equipment: Hardware, Software & Services; By Crop Type; Fruits, Vegetables, Flowers and Ornamentals, Nursey Crops, Other; By Type: Glass Plastic; By Component; High-Tech Commercial Greenhouse, Medium-Tech Commercial Greenhouse, Low-Tech Greenhouse) - Global Industry Analysis, Size, Share, Growth, Trends, Regional Outlook, and Forecast 2023-2032

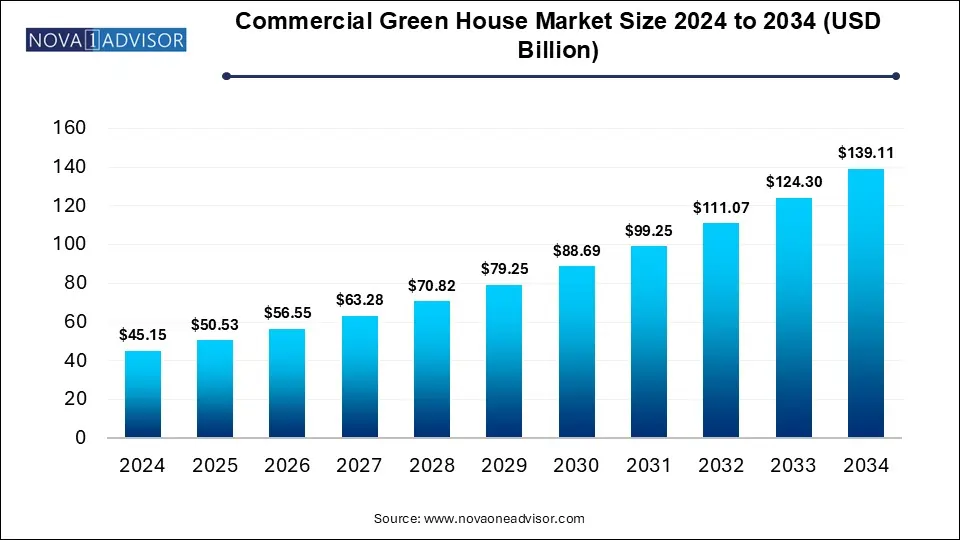
The global commercial greenhouse market size was exhibited at USD 34.9 billion in 2022 and is projected to hit around USD 86.73 billion by 2032, growing at a CAGR of 9.53% during the forecast period 2023 to 2032.

Key Pointers:

  • The vegetables segment hit market share of over 43% in 2022.
  • The fruits segment garnered market share of over 26.3% in 2022.
  • The flowers & ornamentals segment accounted market share of over 17.5%.
  • North America accounted highest market share of over 33.8% in 2022.

Commercial Greenhouse Market Report Scope

Report Coverage

Details

Market Size in 2023

USD 38.23 Billion

Market Size by 2032

USD 86.73 Billion

Growth Rate From 2023 to 2032

CAGR of 9.53%

Base Year

2022

Forecast Period

2023 to 2032

Segments Covered

Equipment, Crop Type, Type, Component

Market Analysis (Terms Used)

Value (US$ Million/Billion) or (Volume/Units)

Regional Scope

North America; Europe; Asia Pacific; Central and South America; the Middle East and Africa

Key Companies Profiled

            Berry Global, Signify Holding, Heliospectra AB, Plastika Kritis, Everlight Electronics, Richel Group, Argus Control Systems, Certhon, Logiqs BV, LumiGrow, Agra-tech, Inc, Rough Brothers, Inc, Hort Americas, Top Greenhouses, Stuppy Greenhouse, The Glasshouse Company, DeCloet Manufacturing Ltd, Europrogress, Luiten Greenhouses, Sotrafa, Nobutec BV, Ammerlaan Constructions, Ludy Greenhouse, Saveer Biotech Ltd (India), Harford (New Zealand)


Commercial greenhouses offer different types of covering materials such as glass or plastic roofs, and frequently glass or plastic walls. An emerging application with high growth potential, commercial greenhouses use several technologies such as heating systems, cooling systems, ventilation systems, LED grow light, communication technology, irrigation system, and control systems.

Controlled environment plant production systems are used widely throughout the world to grow plants at a particular time or place, of a quality that cannot be obtained outdoors. Controlled environment agriculture requires far more capital investments per unit area than field agriculture and must thus be correspondingly more intensive to justify investment costs. The commercial greenhouse industry will have a variety of growth prospects in the future as more people become aware of the technologies that commercial greenhouses utilize for increased yields. The use of renewable energy sources in various applications will be crucial to the expansion of this market throughout the projected period.

Market Dynamics

Drivers: Need for higher yields using limited space and water

One of the main advantages of greenhouse farming is its higher yield compared to conventional farming methods. Enclosed facilities create optimum growing conditions for farmers to grow a crop from seed to the harvesting stages in lesser time and obtain higher yields in each cycle with limited land area. According to USDA data, in 2020, the average yield of tomatoes grown in greenhouse hydroponics was 10.59 pounds per square foot, and that of traditionally grown tomatoes was 1.85 pounds per square foot. Therefore, greenhouse farms can increase the overall crop yield by stacking additional layers and increasing the growing area. According to the Food and Agriculture Organization of the United Nations, food production must increase by 70% by 2050 to meet global food requirements. Since urbanization is taking over arable land while simultaneously decreasing the total agricultural land area, greenhouse farming is a viable option to help meet the food requirements of the increasing population. The level of water wastage is less when compared to conventional farming. Greenhouse farms recirculate and reuse water; an average of 95% less water is required to grow the same crops as compared to outdoor farming. When plants or crops are grown in vertical greenhouses, the transpiration process occurs, which makes it feasible for farmers to reuse the water for irrigation purposes.

Restraints: Limited variety of crops suited to greenhouse farming

Greenhouse farming is suited only to a limited variety of crops and is thus not an attractive option for many growers. Numerous parameters such as temperature adjustment, adequate water supply management, identification, and supply of nutrients to plants, growth mechanism to be adopted, and individual harvest time of plants must be considered before taking up greenhouse plantation. Fruits and vegetables are the most suited for vertical farming, as they require less time to grow, low water supply, and less sunlight. However, only a few varieties of fruits and vegetables can be produced using controlled-environment farming. For instance, some fruits and vegetables have many edible parts such as leaves, stems, and roots. These plant species are not suited to vertical farming.

Crops such as sugarcane, rice, and wheat require a high amount of water and more harvesting time, and are hence, difficult to cultivate using greenhouse farming. Rice and wheat are major crops in the APAC region and are grown year-around to feed the growing population. These crops are difficult to grow in greenhouses; this result in slow penetration of commercial greenhouse farming in these regions.

Opportunities: R&D initiatives to improve greenhouse farming methods

Agriculture, as a field, attracts the most scientific R&D. Climate change challenges and environmental concerns have resulted in the development of various methods to ensure food security worldwide. Greenhouse farming is attracting scientists, researchers, and farmers. Experts are trying to introduce greenhouse farming to eliminate the basic problem of climate control in temperate regions. As per the Advanced Horticulture Research Facility, active cooling methods are useful in establishing an optimum environment. Various methods are being studied, such as photovoltaic (PV)-based shading methods for the passive cooling of greenhouses. The current humidity-control techniques used in the protected cropping industry are being improved, and experts are identifying future research opportunities in this area. In 2020, the overall budget for the European Union (EU) was USD 197.1 billion. Spending on agriculture, rural development and fisheries amounted to USD 69.2 billion, which was 35% of the total budget.

Challenges: Lack of temperature control systems to maintain optimum crop production conditions in warm regions

One of the key environmental elements influencing crop growth, development, yield, and particularly the pace of development, is temperature. Crops have fundamental requirements for temperature to finish a whole life cycle. Extremely low and high temperatures can have a negative impact on crop development, growth, and yield, especially at crucial stages like flowering. Urban and semi-urban areas of developing countries are attracting a lot of attention for commercial greenhouse farming techniques. Temperature control in tropical regions like Middle-east, parts of asia-pacific and Africa is challenging owing to its hot and humid climate which hampers the crop growth. Maintaining the climate in such warm regions require unique approaches compared to the techniques used in temperate conditions. Suitable technologies are urgently required to maintain an optimum growing environment in these regions

Some of the prominent players in the Commercial Greenhouse Market include:

  • Berry Global (US)
  • Signify Holding (Netherlands)
  • Heliospectra AB (Sweden)
  • Plastika Kritis (Greece)
  • Everlight Electronics (Taiwan)
  • Richel Group (France)
  • Argus Control Systems (Canada)
  • Certhon (The Netherlands)
  • Logiqs BV (The Netherlands)
  • LumiGrow (US)
  • Agra-tech, Inc (US)
  • Rough Brothers, Inc (US)
  • Hort Americas (US)
  • Top Greenhouses (India)
  • Stuppy Greenhouse (US)
  • The Glasshouse Company (Australia)
  • DeCloet Manufacturing Ltd (Canada)
  • Europrogress (Italy)
  • Luiten Greenhouses (New Zealand)
  • Sotrafa (Spain)
  • Nobutec BV (The Netherlands)
  • Ammerlaan Constructions (The Netherlands)
  • Ludy Greenhouse (US)
  • Saveer Biotech Ltd (India)
  • Harford (New Zealand)

Segments Covered in the Report

This report forecasts revenue growth at global, regional, and country levels and provides an analysis of the latest industry trends in each of the sub-segments from 2018 to 2032. For this study, Nova one advisor, Inc. has segmented the global Commercial Greenhouse market.

By Equipment

  • Hardware
  • Software & Services

By Crop Type

  • Fruits
  • Vegetables
  • Flowers and Ornamentals
  • Nursey Crops
  • Other

By Type

  • Glass
  • Plastic

By Component

  • High-Tech Commercial Greenhouse
  • Medium-Tech Commercial Greenhouse
  • Low-Tech Greenhouse

By Region

  • North America
  • Europe
  • Asia-Pacific
  • Latin America
  • Middle East & Africa (MEA)

Frequently Asked Questions

The global commercial greenhouse market size was exhibited at USD 34.9 billion in 2022 and is projected to hit around USD 86.73 billion by 2032

The global commercial greenhouse market is poised to grow at a CAGR of 9.53% from 2022 to 2030.

The major players operating in the commercial greenhouse market are Berry Global, Signify Holding, Heliospectra AB, Plastika Kritis, Everlight Electronics, Richel Group, Argus Control Systems, Certhon, Logiqs BV, LumiGrow, Agra-tech, Inc, Rough Brothers, Inc, Hort Americas, Top Greenhouses, Stuppy Greenhouse, The Glasshouse Company, DeCloet Manufacturing Ltd, Europrogress, Luiten Greenhouses, Sotrafa, Nobutec BV, Ammerlaan Constructions, Ludy Greenhouse, and Others

North America region will lead the global commercial greenhouse market during the forecast period 2023 to 2032.

Chapter 1. Introduction

1.1. Research Objective

1.2. Scope of the Study

1.3. Definition

Chapter 2. Research Methodology

2.1. Research Approach

2.2. Data Sources

2.3. Assumptions & Limitations

Chapter 3. Executive Summary

3.1. Market Snapshot

Chapter 4. Market Variables and Scope 

4.1. Introduction

4.2. Market Classification and Scope

4.3. Industry Value Chain Analysis

4.3.1. Raw Material Procurement Analysis 

4.3.2. Sales and Distribution Channel Analysis

4.3.3. Downstream Buyer Analysis

Chapter 5. COVID 19 Impact on Commercial Greenhouse Market 

5.1. COVID-19 Landscape: Commercial Greenhouse Industry Impact

5.2. COVID 19 - Impact Assessment for the Industry

5.3. COVID 19 Impact: Global Major Government Policy

5.4. Market Trends and Opportunities in the COVID-19 Landscape

Chapter 6. Market Dynamics Analysis and Trends

6.1. Market Dynamics

6.1.1. Market Drivers

6.1.2. Market Restraints

6.1.3. Market Opportunities

6.2. Porter’s Five Forces Analysis

6.2.1. Bargaining power of suppliers

6.2.2. Bargaining power of buyers

6.2.3. Threat of substitute

6.2.4. Threat of new entrants

6.2.5. Degree of competition

Chapter 7. Competitive Landscape

7.1.1. Company Market Share/Positioning Analysis

7.1.2. Key Strategies Adopted by Players

7.1.3. Vendor Landscape

7.1.3.1. List of Suppliers

7.1.3.2. List of Buyers

Chapter 8. Global Commercial Greenhouse Market, By Equipment

8.1. Commercial Greenhouse Market, by Equipment, 2023-2032

8.1.1. Hardware

8.1.1.1. Market Revenue and Forecast (2020-2032)

8.1.2. Software & Services

8.1.2.1. Market Revenue and Forecast (2020-2032)

Chapter 9. Global Commercial Greenhouse Market, By Crop Type

9.1. Commercial Greenhouse Market, by Crop Type, 2023-2032

9.1.1. Fruits

9.1.1.1. Market Revenue and Forecast (2020-2032)

9.1.2. Vegetables

9.1.2.1. Market Revenue and Forecast (2020-2032)

9.1.3. Flowers and Ornamentals

9.1.3.1. Market Revenue and Forecast (2020-2032)

9.1.4. Nursey Crops

9.1.4.1. Market Revenue and Forecast (2020-2032)

9.1.5. Other

9.1.5.1. Market Revenue and Forecast (2020-2032)

Chapter 10. Global Commercial Greenhouse Market, By Type 

10.1. Commercial Greenhouse Market, by Type, 2023-2032

10.1.1. Glass

10.1.1.1. Market Revenue and Forecast (2020-2032)

10.1.2. Plastic

10.1.2.1. Market Revenue and Forecast (2020-2032)

Chapter 11. Global Commercial Greenhouse Market, By Component 

11.1. Commercial Greenhouse Market, by Component, 2023-2032

11.1.1. High-Tech Commercial Greenhouse

11.1.1.1. Market Revenue and Forecast (2020-2032)

11.1.2. Medium-Tech Commercial Greenhouse

11.1.2.1. Market Revenue and Forecast (2020-2032)

11.1.3. Low-Tech Greenhouse

11.1.3.1. Market Revenue and Forecast (2020-2032)

Chapter 12. Global Commercial Greenhouse Market, Regional Estimates and Trend Forecast

12.1. North America

12.1.1. Market Revenue and Forecast, by Equipment (2020-2032)

12.1.2. Market Revenue and Forecast, by Crop Type (2020-2032)

12.1.3. Market Revenue and Forecast, by Type (2020-2032)

12.1.4. Market Revenue and Forecast, by Component (2020-2032)

12.1.5. U.S.

12.1.5.1. Market Revenue and Forecast, by Equipment (2020-2032)

12.1.5.2. Market Revenue and Forecast, by Crop Type (2020-2032)

12.1.5.3. Market Revenue and Forecast, by Type (2020-2032)

12.1.5.4. Market Revenue and Forecast, by Component (2020-2032)

12.1.6. Rest of North America

12.1.6.1. Market Revenue and Forecast, by Equipment (2020-2032)

12.1.6.2. Market Revenue and Forecast, by Crop Type (2020-2032)

12.1.6.3. Market Revenue and Forecast, by Type (2020-2032)

12.1.6.4. Market Revenue and Forecast, by Component (2020-2032)

12.2. Europe

12.2.1. Market Revenue and Forecast, by Equipment (2020-2032)

12.2.2. Market Revenue and Forecast, by Crop Type (2020-2032)

12.2.3. Market Revenue and Forecast, by Type (2020-2032)

12.2.4. Market Revenue and Forecast, by Component (2020-2032)

12.2.5. UK

12.2.5.1. Market Revenue and Forecast, by Equipment (2020-2032)

12.2.5.2. Market Revenue and Forecast, by Crop Type (2020-2032)

12.2.5.3. Market Revenue and Forecast, by Type (2020-2032)

12.2.5.4. Market Revenue and Forecast, by Component (2020-2032)

12.2.6. Germany

12.2.6.1. Market Revenue and Forecast, by Equipment (2020-2032)

12.2.6.2. Market Revenue and Forecast, by Crop Type (2020-2032)

12.2.6.3. Market Revenue and Forecast, by Type (2020-2032)

12.2.6.4. Market Revenue and Forecast, by Component (2020-2032)

12.2.7. France

12.2.7.1. Market Revenue and Forecast, by Equipment (2020-2032)

12.2.7.2. Market Revenue and Forecast, by Crop Type (2020-2032)

12.2.7.3. Market Revenue and Forecast, by Type (2020-2032)

12.2.7.4. Market Revenue and Forecast, by Component (2020-2032)

12.2.8. Rest of Europe

12.2.8.1. Market Revenue and Forecast, by Equipment (2020-2032)

12.2.8.2. Market Revenue and Forecast, by Crop Type (2020-2032)

12.2.8.3. Market Revenue and Forecast, by Type (2020-2032)

12.2.8.4. Market Revenue and Forecast, by Component (2020-2032)

12.3. APAC

12.3.1. Market Revenue and Forecast, by Equipment (2020-2032)

12.3.2. Market Revenue and Forecast, by Crop Type (2020-2032)

12.3.3. Market Revenue and Forecast, by Type (2020-2032)

12.3.4. Market Revenue and Forecast, by Component (2020-2032)

12.3.5. India

12.3.5.1. Market Revenue and Forecast, by Equipment (2020-2032)

12.3.5.2. Market Revenue and Forecast, by Crop Type (2020-2032)

12.3.5.3. Market Revenue and Forecast, by Type (2020-2032)

12.3.5.4. Market Revenue and Forecast, by Component (2020-2032)

12.3.6. China

12.3.6.1. Market Revenue and Forecast, by Equipment (2020-2032)

12.3.6.2. Market Revenue and Forecast, by Crop Type (2020-2032)

12.3.6.3. Market Revenue and Forecast, by Type (2020-2032)

12.3.6.4. Market Revenue and Forecast, by Component (2020-2032)

12.3.7. Japan

12.3.7.1. Market Revenue and Forecast, by Equipment (2020-2032)

12.3.7.2. Market Revenue and Forecast, by Crop Type (2020-2032)

12.3.7.3. Market Revenue and Forecast, by Type (2020-2032)

12.3.7.4. Market Revenue and Forecast, by Component (2020-2032)

12.3.8. Rest of APAC

12.3.8.1. Market Revenue and Forecast, by Equipment (2020-2032)

12.3.8.2. Market Revenue and Forecast, by Crop Type (2020-2032)

12.3.8.3. Market Revenue and Forecast, by Type (2020-2032)

12.3.8.4. Market Revenue and Forecast, by Component (2020-2032)

12.4. MEA

12.4.1. Market Revenue and Forecast, by Equipment (2020-2032)

12.4.2. Market Revenue and Forecast, by Crop Type (2020-2032)

12.4.3. Market Revenue and Forecast, by Type (2020-2032)

12.4.4. Market Revenue and Forecast, by Component (2020-2032)

12.4.5. GCC

12.4.5.1. Market Revenue and Forecast, by Equipment (2020-2032)

12.4.5.2. Market Revenue and Forecast, by Crop Type (2020-2032)

12.4.5.3. Market Revenue and Forecast, by Type (2020-2032)

12.4.5.4. Market Revenue and Forecast, by Component (2020-2032)

12.4.6. North Africa

12.4.6.1. Market Revenue and Forecast, by Equipment (2020-2032)

12.4.6.2. Market Revenue and Forecast, by Crop Type (2020-2032)

12.4.6.3. Market Revenue and Forecast, by Type (2020-2032)

12.4.6.4. Market Revenue and Forecast, by Component (2020-2032)

12.4.7. South Africa

12.4.7.1. Market Revenue and Forecast, by Equipment (2020-2032)

12.4.7.2. Market Revenue and Forecast, by Crop Type (2020-2032)

12.4.7.3. Market Revenue and Forecast, by Type (2020-2032)

12.4.7.4. Market Revenue and Forecast, by Component (2020-2032)

12.4.8. Rest of MEA

12.4.8.1. Market Revenue and Forecast, by Equipment (2020-2032)

12.4.8.2. Market Revenue and Forecast, by Crop Type (2020-2032)

12.4.8.3. Market Revenue and Forecast, by Type (2020-2032)

12.4.8.4. Market Revenue and Forecast, by Component (2020-2032)

12.5. Latin America

12.5.1. Market Revenue and Forecast, by Equipment (2020-2032)

12.5.2. Market Revenue and Forecast, by Crop Type (2020-2032)

12.5.3. Market Revenue and Forecast, by Type (2020-2032)

12.5.4. Market Revenue and Forecast, by Component (2020-2032)

12.5.5. Brazil

12.5.5.1. Market Revenue and Forecast, by Equipment (2020-2032)

12.5.5.2. Market Revenue and Forecast, by Crop Type (2020-2032)

12.5.5.3. Market Revenue and Forecast, by Type (2020-2032)

12.5.5.4. Market Revenue and Forecast, by Component (2020-2032)

12.5.6. Rest of LATAM

12.5.6.1. Market Revenue and Forecast, by Equipment (2020-2032)

12.5.6.2. Market Revenue and Forecast, by Crop Type (2020-2032)

12.5.6.3. Market Revenue and Forecast, by Type (2020-2032)

12.5.6.4. Market Revenue and Forecast, by Component (2020-2032)

Chapter 13. Company Profiles

13.1. Berry Global (US)

13.1.1. Company Overview

13.1.2. Product Offerings

13.1.3. Financial Performance

13.1.4. Recent Initiatives

13.2. Signify Holding (Netherlands)

13.2.1. Company Overview

13.2.2. Product Offerings

13.2.3. Financial Performance

13.2.4. Recent Initiatives

13.3. Heliospectra AB (Sweden)

13.3.1. Company Overview

13.3.2. Product Offerings

13.3.3. Financial Performance

13.3.4. Recent Initiatives

13.4. Plastika Kritis (Greece)

13.4.1. Company Overview

13.4.2. Product Offerings

13.4.3. Financial Performance

13.4.4. Recent Initiatives

13.5. Everlight Electronics (Taiwan)

13.5.1. Company Overview

13.5.2. Product Offerings

13.5.3. Financial Performance

13.5.4. Recent Initiatives

13.6. Richel Group (France)

13.6.1. Company Overview

13.6.2. Product Offerings

13.6.3. Financial Performance

13.6.4. Recent Initiatives

13.7. Argus Control Systems (Canada)

13.7.1. Company Overview

13.7.2. Product Offerings

13.7.3. Financial Performance

13.7.4. Recent Initiatives

13.8. Certhon (The Netherlands)

13.8.1. Company Overview

13.8.2. Product Offerings

13.8.3. Financial Performance

13.8.4. Recent Initiatives

13.9. Logiqs BV (The Netherlands)

13.9.1. Company Overview

13.9.2. Product Offerings

13.9.3. Financial Performance

13.9.4. Recent Initiatives

13.10. LumiGrow (US)

13.10.1. Company Overview

13.10.2. Product Offerings

13.10.3. Financial Performance

13.10.4. Recent Initiatives

Chapter 14. Research Methodology

14.1. Primary Research

14.2. Secondary Research

14.3. Assumptions

Chapter 15. Appendix

15.1. About Us

15.2. Glossary of Terms

Proceed To Buy

USD 4500
USD 3800
USD 1900
USD 1200

Customization Offered

  • check-img Cross-segment Market Size and Analysis for Mentioned Segments
  • check-imgAdditional Company Profiles (Upto 5 With No Cost)
  • check-img Additional Countries (Apart From Mentioned Countries)
  • check-img Country/Region-specific Report
  • check-img Go To Market Strategy
  • check-imgRegion Specific Market Dynamics
  • check-imgRegion Level Market Share
  • check-img Import Export Analysis
  • check-imgProduction Analysis
  • check-imgOthers