Dairy Products Market (By Product Type: Milk, Cheese, Butter, Desserts, Yogurt, and Others; By Distribution Channel: Supermarket/Hypermarket, Specialty Stores, Convenience Stores, and Others) - Global Industry Analysis, Size, Share, Growth, Trends, Regional Outlook, and Forecast 2022 - 2030

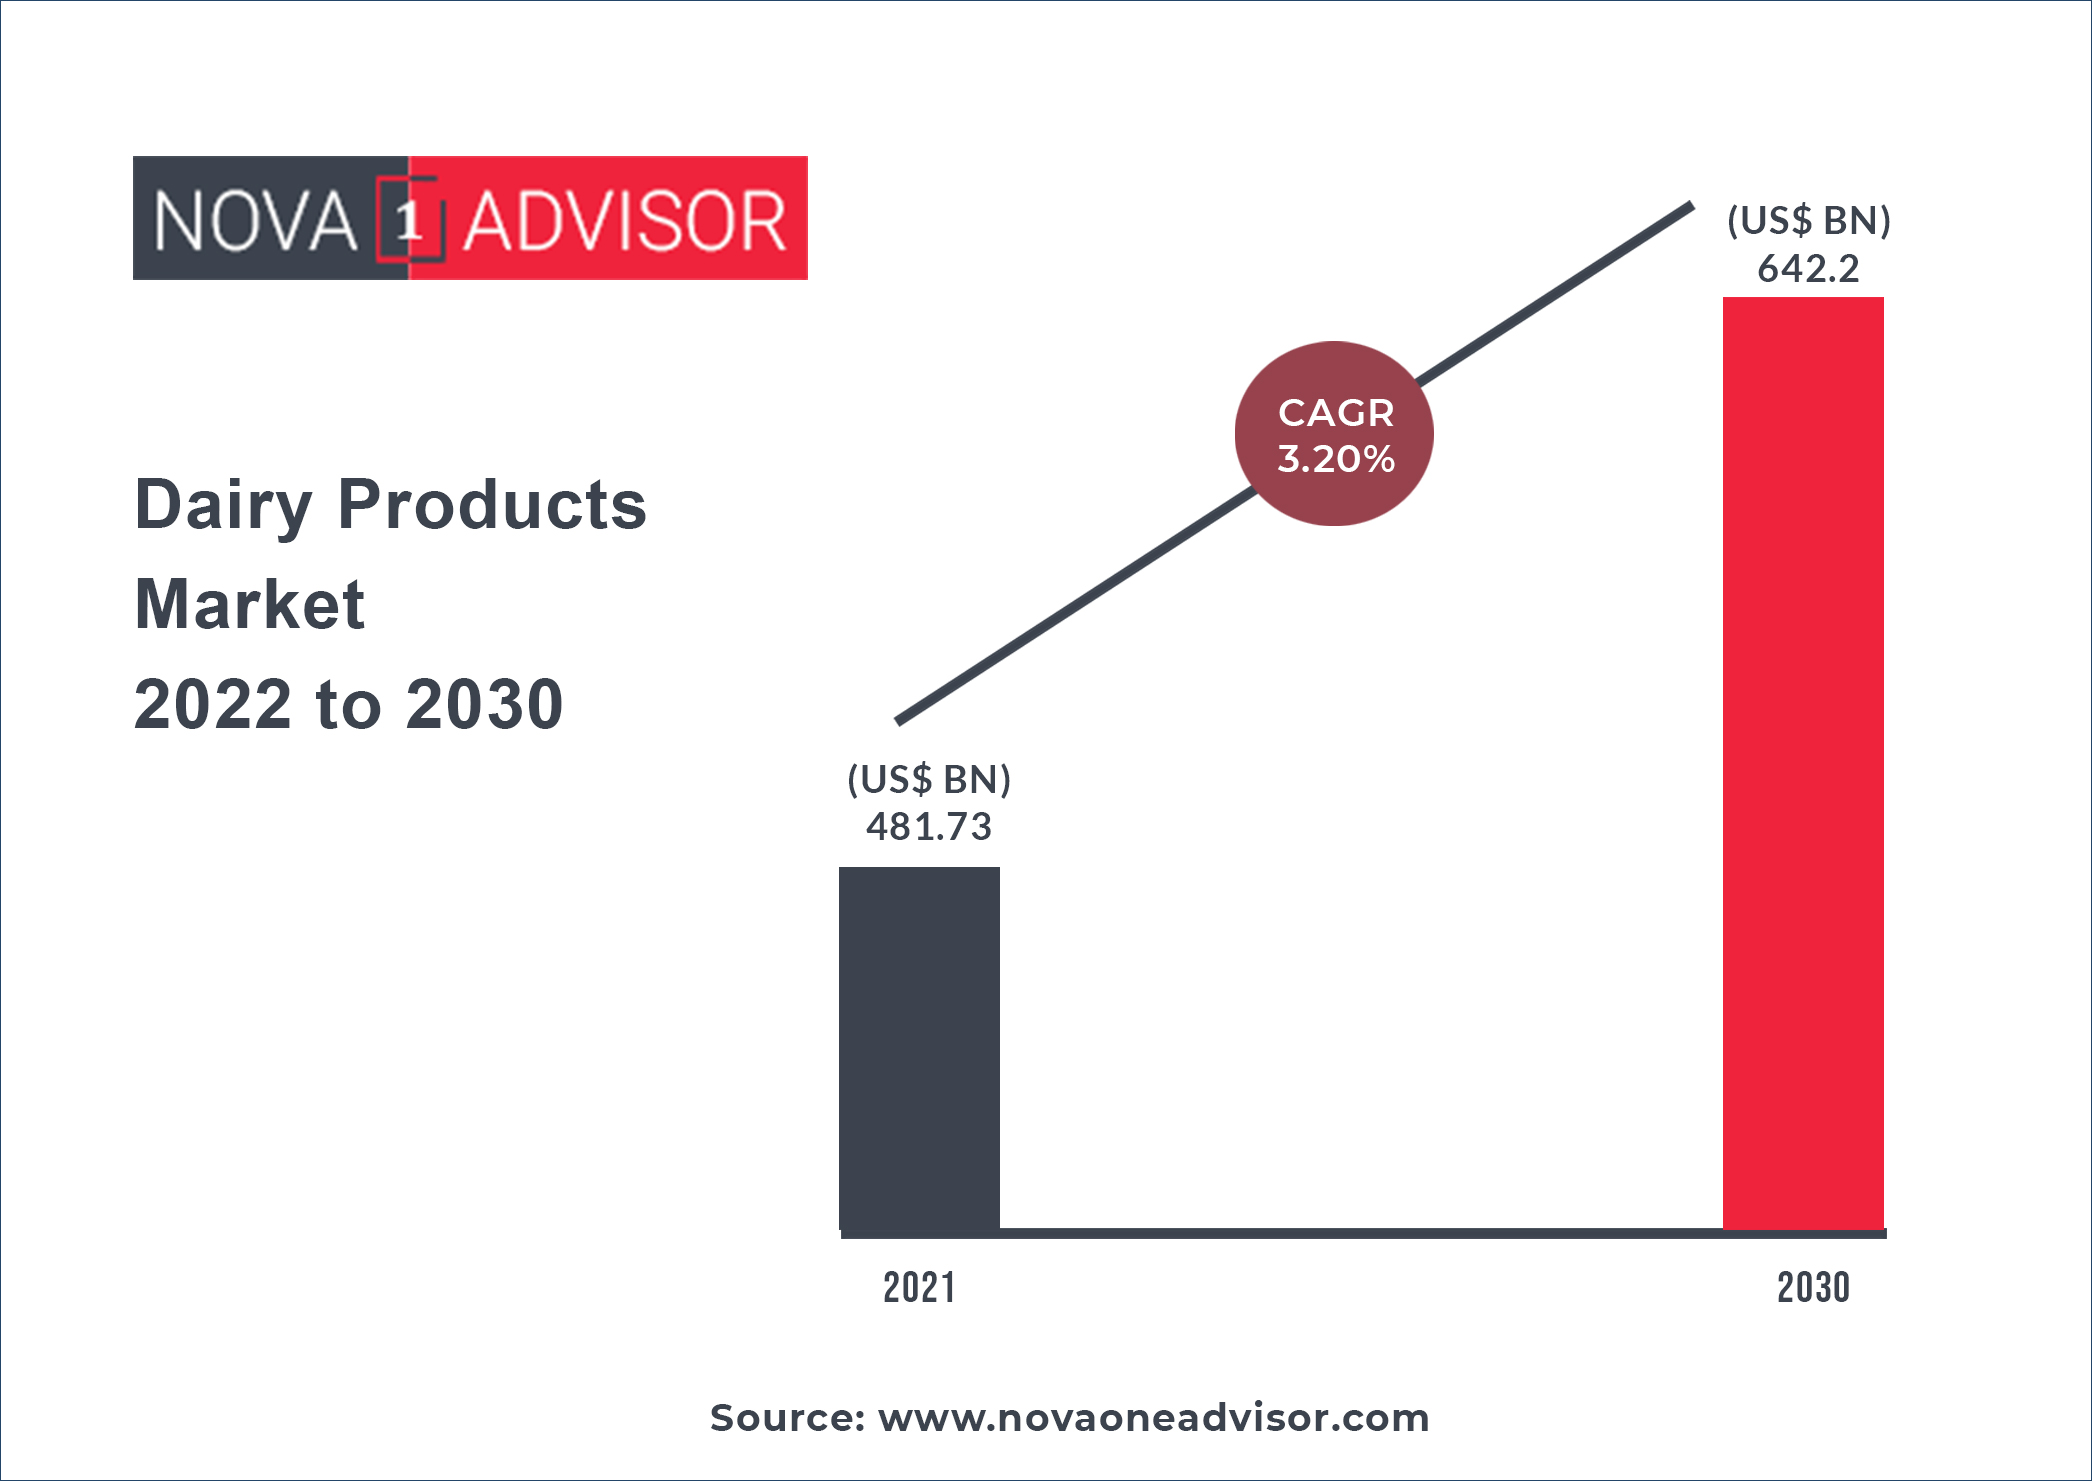
The global Dairy Products market gathered revenue around USD 481.73 billion in 2021 and market is set to grow USD 642.2 billion by the end of 2030 and is estimated to expand at a modest CAGR of 3.2% during the prediction period 2022 to 2030.
https://www.novaoneadvisor.com/reportimg/Dairy-Products-Market-2022-to-2030.jpg

Growth Factors:

The rising consumption of dairy products and shifting consumer preference from meat to dairy products for protein enrichment are the significant drivers for this market’s growth. The easy availability of dairy products due to modern retail facilities and cold chain logistics further drives the market growth. Furthermore, significant product sales through online distribution channels during the Covid-19 pandemic also supported the market growth. Dairy products offer various health benefits as they are rich in calcium, riboflavin, vitamin D, vitamin A, niacin, potassium, and phosphorus.

Regular consumption of dairy products improves bone and gut health and reduces the risks of Cardiovascular Diseases (CVDs) and type 2 diabetes. The rising demand for cheese in developing nations is also expected to drive the market. Earlier, cheese was considered unhealthy due to its association with a high amount of fats.

However, recent studies have shown that cheese is good for heart health and could be an excellent source of calcium for people with lactose intolerance. Growing focus on infant nutrition and demand for organic clean label dairy products are also expected to boost the market growth. The market has several growth opportunities, as consumers are willing to try new products.

Innovation in yogurts, such as fat-free, flavored, and drinkable yogurt, is expected to provide the manufacturers with significant growth opportunities. Innovation in the packaging, such as small portion size, on-the-go packs, and single-serve, is also driving the product demand, providing a massive opportunity to the manufacturers

Scope of the Dairy Products Market Report

Report Highlights

Details

Market Size

USD 642.2 Billion by 2030

Growth Rate

CAGR of 3.2% From 2022 to 2030

Fastest Growing Market

North America

Largest Market

Asia Pacific

Base Year

2021

Forecast Period

2022 to 2030

Segments Covered

Product, Distribution Channel, Region

Companies Mentioned

Arla Foods Amba, Danone, Fonterra, Lactalis, Nestle, Frieslandcampina, DMK Group, Dairy Farmers of America, Inc., GCMMF, Meiji Holdings Co. Ltd., The Kraft Heinz Company

Product Type Insights

By product type, the milk segment led the global dairy products market with remarkable revenue share in 2020 and is anticipated to retain its dominance throughout the forecast period. The dominance of milk is attributed to the increased consumption of milk in households and various commercial units all over the globe. The nutritional properties of milk and the increased awareness regarding the health benefits of milk are driving the growth of this segment across the global market.

On the other hand, yogurt segment is estimated to be the most opportunistic segment during the forecast period owing to its increased consumption. Consumers prefer to eat yogurt and include it in their regular diet in order to improve gut health and build strong immunity. Hence, rising adoption of yogurt in regular diet is estimated to propel the segment growth during the forecast period.

Distribution Channel Insights

By distribution channel, the supermarket/hypermarket stores segment led the global dairy products market with remarkable revenue share in 2020 and is anticipated to retain its dominance throughout the forecast period. The supermarkets attract a huge customer base due to the availability of wide variety of food and beverages products and household groceries. Therefore, consumers prefer to buy household essentials and groceries on weekly or monthly basis. Further, the supermarkets are located in urban and easy accessible areas.This sales channel generates a regular revenue stream for the dairy products manufacturers.

On the other hand, the others segment is expected to be the fastest-growing segment due to the rising adoption of food delivery platforms among the consumers. The rapid growth of the online food and grocery delivery platforms in the global market has boosted the sales of the dairy products and is expected to grow rapidly in the forthcoming years.

Regional Insights

Europe accounted for the largest revenue share of around 31.9% in 2019 and is expected to continue its dominance over the forecast period. Germany is expected to witness significant growth due to rising consumer demand for cheese, creamers, and milk desserts. Moreover, demand for clean label and high-quality dairy products is likely to propel the market growth in the region.

North America also captured a significant revenue share in the past. The U.S. accounted for the largest revenue share of the regional market due to the high consumption of cheese and milk in the country. Furthermore, innovation in milk products, such as low-fat and no-sugar milk, is expected to increase the consumption of milk.

Asia Pacific is anticipated to be the largest as well as the fastest-growing regional market during the forecast years due to rising demand for packaged and quality dairy products. Furthermore, the growth of the online distribution channels in the APAC region is driving the market. India, in particular, is expected to witness the fastest growth rate in the regional market due to the increasing demand for value-added dairy products like yogurt and cheese.

Some of the prominent players in the Dairy Products Market include:

  • Arla Foods Amba
  • Nestle
  • Danone
  • Fonterra
  • Lactalis
  • Frieslandcampina
  • DMK Group
  • GCMMF
  • Dairy Farmers of America, Inc.
  • Meiji Holdings Co. Ltd.
  • The Kraft Heinz Company

Segments Covered in the Report

This research report offers market revenue, sales volume, production assessment and prognoses by classifying it on the basis of various aspects. Further, this research study investigates market size, production, consumption and its development trends at global, regional, and country level for the period of 2017 to 2030 and covers subsequent region in its scope:

By Product Type

  • Milk
  • Cheese
  • Butter
  • Desserts
  • Yogurt
  • Others

By Distribution Channel

  • Supermarket/Hypermarket
  • Specialty Stores
  • Convenience Stores
  • Others

By Geography

North America

  • U.S.
  • Canada

Europe

  • Germany
  • France
  • United Kingdom
  • Rest of Europe

Asia Pacific

  • China
  • Japan
  • India
  • Southeast Asia
  • Rest of Asia Pacific

Latin America

  • Brazil
  • Rest of Latin America

Middle East & Africa (MEA)

  • GCC
  • North Africa
  • South Africa
  • Rest of Middle East & Africa

Key Points Covered in Dairy Products Market Study:

  • Growth of Dairy Products in 2022
  • Market Estimates and Forecasts (2017-2030)
  •  Brand Share and Market Share Analysis
  •  Key Drivers and Restraints Shaping Market Growth
  •  Segment-wise, Country-wise, and Region-wise Analysis
  •  Competition Mapping and Benchmarking
  •  Recommendation on Key Winning Strategies
  •  COVID-19 Impact on Demand for Dairy Products and How to Navigate
  •  Key Product Innovations and Regulatory Climate
  •  Dairy Products Consumption Analysis
  •  Dairy Products Production Analysis
  •  Dairy Products and Management

Chapter 1. Introduction

1.1. Research Objective

1.2. Scope of the Study

1.3. Definition

Chapter 2. Research Methodology

2.1. Research Approach

2.2. Data Sources

2.3. Assumptions & Limitations

Chapter 3. Executive Summary

3.1. Market Snapshot

Chapter 4. Market Variables and Scope 

4.1. Introduction

4.2. Market Classification and Scope

4.3. Industry Value Chain Analysis

4.3.1. Raw Material Procurement Analysis 

4.3.2. Sales and Distribution Channel Analysis

4.3.3. Downstream Buyer Analysis

Chapter 5. Market Dynamics Analysis and Trends

5.1. Market Dynamics

5.1.1. Market Drivers

5.1.2. Market Restraints

5.1.3. Market Opportunities

5.2. Porter’s Five Forces Analysis

5.2.1. Bargaining power of suppliers

5.2.2. Bargaining power of buyers

5.2.3. Threat of substitute

5.2.4. Threat of new entrants

5.2.5. Degree of competition

Chapter 6. Competitive Landscape

6.1.1. Company Market Share/Positioning Analysis

6.1.2. Key Strategies Adopted by Players

6.1.3. Vendor Landscape

6.1.3.1. List of Suppliers

6.1.3.2. List of Buyers

Chapter 7. Global Dairy Products Market, By Product

7.1. Dairy Products Market, by Product Type, 2021-2030

7.1.1. Milk

7.1.1.1. Market Revenue and Forecast (2019-2030)

7.1.2.  Cheese

7.1.2.1. Market Revenue and Forecast (2019-2030)

7.1.3.  Butter

7.1.3.1. Market Revenue and Forecast (2019-2030)

7.1.4.  Desserts

7.1.4.1. Market Revenue and Forecast (2019-2030)

7.1.5.  Yogurt

7.1.5.1. Market Revenue and Forecast (2019-2030)

7.1.6.  Others

7.1.6.1. Market Revenue and Forecast (2019-2030)

Chapter 8. Global Dairy Products Market, By Distribution Channel

8.1. Dairy Products Market, by Distribution Channel, 2021-2030

8.1.1.  Supermarket/Hypermarket

8.1.1.1. Market Revenue and Forecast (2019-2030)

8.1.2.  Specialty Stores

8.1.2.1. Market Revenue and Forecast (2019-2030)

8.1.3.  Convenience Stores

8.1.3.1. Market Revenue and Forecast (2019-2030)

8.1.4.  Others

8.1.4.1. Market Revenue and Forecast (2019-2030)

Chapter 9. Global Dairy Products Market, Regional Estimates and Trend Forecast

9.1. North America

9.1.1. Market Revenue and Forecast, by Product (2019-2030)

9.1.2. Market Revenue and Forecast, by Distribution Channel (2019-2030)

9.1.3. U.S.

9.1.3.1. Market Revenue and Forecast, by Product (2019-2030)

9.1.3.2. Market Revenue and Forecast, by Distribution Channel (2019-2030)

9.1.4. Rest of North America

9.1.4.1. Market Revenue and Forecast, by Product (2019-2030)

9.1.4.2. Market Revenue and Forecast, by Distribution Channel (2019-2030)

9.2. Europe

9.2.1. Market Revenue and Forecast, by Product (2019-2030)

9.2.2. Market Revenue and Forecast, by Distribution Channel (2019-2030)

9.2.3. UK

9.2.3.1. Market Revenue and Forecast, by Product (2019-2030)

9.2.3.2. Market Revenue and Forecast, by Distribution Channel (2019-2030)

9.2.4. Germany

9.2.4.1. Market Revenue and Forecast, by Product (2019-2030)

9.2.4.2. Market Revenue and Forecast, by Distribution Channel (2019-2030)

9.2.5. France

9.2.5.1. Market Revenue and Forecast, by Product (2019-2030)

9.2.5.2. Market Revenue and Forecast, by Distribution Channel (2019-2030)

9.2.6. Rest of Europe

9.2.6.1. Market Revenue and Forecast, by Product (2019-2030)

9.2.6.2. Market Revenue and Forecast, by Distribution Channel (2019-2030)

9.3. APAC

9.3.1. Market Revenue and Forecast, by Product (2019-2030)

9.3.2. Market Revenue and Forecast, by Distribution Channel (2019-2030)

9.3.3. India

9.3.3.1. Market Revenue and Forecast, by Product (2019-2030)

9.3.3.2. Market Revenue and Forecast, by Distribution Channel (2019-2030)

9.3.4. China

9.3.4.1. Market Revenue and Forecast, by Product (2019-2030)

9.3.4.2. Market Revenue and Forecast, by Distribution Channel (2019-2030)

9.3.5. Japan

9.3.5.1. Market Revenue and Forecast, by Product (2019-2030)

9.3.5.2. Market Revenue and Forecast, by Distribution Channel (2019-2030)

9.3.6. Rest of APAC

9.3.6.1. Market Revenue and Forecast, by Product (2019-2030)

9.3.6.2. Market Revenue and Forecast, by Distribution Channel (2019-2030)

9.4. MEA

9.4.1. Market Revenue and Forecast, by Product (2019-2030)

9.4.2. Market Revenue and Forecast, by Distribution Channel (2019-2030)

9.4.3. GCC

9.4.3.1. Market Revenue and Forecast, by Product (2019-2030)

9.4.3.2. Market Revenue and Forecast, by Distribution Channel (2019-2030)

9.4.4. North Africa

9.4.4.1. Market Revenue and Forecast, by Product (2019-2030)

9.4.4.2. Market Revenue and Forecast, by Distribution Channel (2019-2030)

9.4.5. South Africa

9.4.5.1. Market Revenue and Forecast, by Product (2019-2030)

9.4.5.2. Market Revenue and Forecast, by Distribution Channel (2019-2030)

9.4.6. Rest of MEA

9.4.6.1. Market Revenue and Forecast, by Product (2019-2030)

9.4.6.2. Market Revenue and Forecast, by Distribution Channel (2019-2030)

9.5. Latin America

9.5.1. Market Revenue and Forecast, by Product (2019-2030)

9.5.2. Market Revenue and Forecast, by Distribution Channel (2019-2030)

9.5.3. Brazil

9.5.3.1. Market Revenue and Forecast, by Product (2019-2030)

9.5.3.2. Market Revenue and Forecast, by Distribution Channel (2019-2030)

9.5.4. Rest of LATAM

9.5.4.1. Market Revenue and Forecast, by Product (2019-2030)

9.5.4.2. Market Revenue and Forecast, by Distribution Channel (2019-2030)

Chapter 10. Company Profiles

10.1. Arla Foods Amba

10.1.1. Company Overview

10.1.2. Product Offerings

10.1.3. Financial Performance

10.1.4. Recent Initiatives

10.2. Nestle

10.2.1. Company Overview

10.2.2. Product Offerings

10.2.3. Financial Performance

10.2.4. Recent Initiatives

10.3. Danone

10.3.1. Company Overview

10.3.2. Product Offerings

10.3.3. Financial Performance

10.3.4. Recent Initiatives

10.4. Fonterra

10.4.1. Company Overview

10.4.2. Product Offerings

10.4.3. Financial Performance

10.4.4. Recent Initiatives

10.5. Lactalis

10.5.1. Company Overview

10.5.2. Product Offerings

10.5.3. Financial Performance

10.5.4. Recent Initiatives

10.6. Frieslandcampina

10.6.1. Company Overview

10.6.2. Product Offerings

10.6.3. Financial Performance

10.6.4. Recent Initiatives

10.7. DMK Group

10.7.1. Company Overview

10.7.2. Product Offerings

10.7.3. Financial Performance

10.7.4. Recent Initiatives

10.8. GCMMF

10.8.1. Company Overview

10.8.2. Product Offerings

10.8.3. Financial Performance

10.8.4. Recent Initiatives

10.9. Dairy Farmers of America, Inc.

10.9.1. Company Overview

10.9.2. Product Offerings

10.9.3. Financial Performance

10.9.4. Recent Initiatives

10.10. Meiji Holdings Co. Ltd.

10.10.1. Company Overview

10.10.2. Product Offerings

10.10.3. Financial Performance

10.10.4. Recent Initiatives

Chapter 11. Research Methodology

11.1. Primary Research

11.2. Secondary Research

11.3. Assumptions

Chapter 12. Appendix

12.1. About Us

12.2. Glossary of Terms

Proceed To Buy

USD 4500
USD 3900
USD 1900
USD 1200

Customization Offered

  • check-img Cross-segment Market Size and Analysis for Mentioned Segments
  • check-imgAdditional Company Profiles (Upto 5 With No Cost)
  • check-img Additional Countries (Apart From Mentioned Countries)
  • check-img Country/Region-specific Report
  • check-img Go To Market Strategy
  • check-imgRegion Specific Market Dynamics
  • check-imgRegion Level Market Share
  • check-img Import Export Analysis
  • check-imgProduction Analysis
  • check-imgOthers