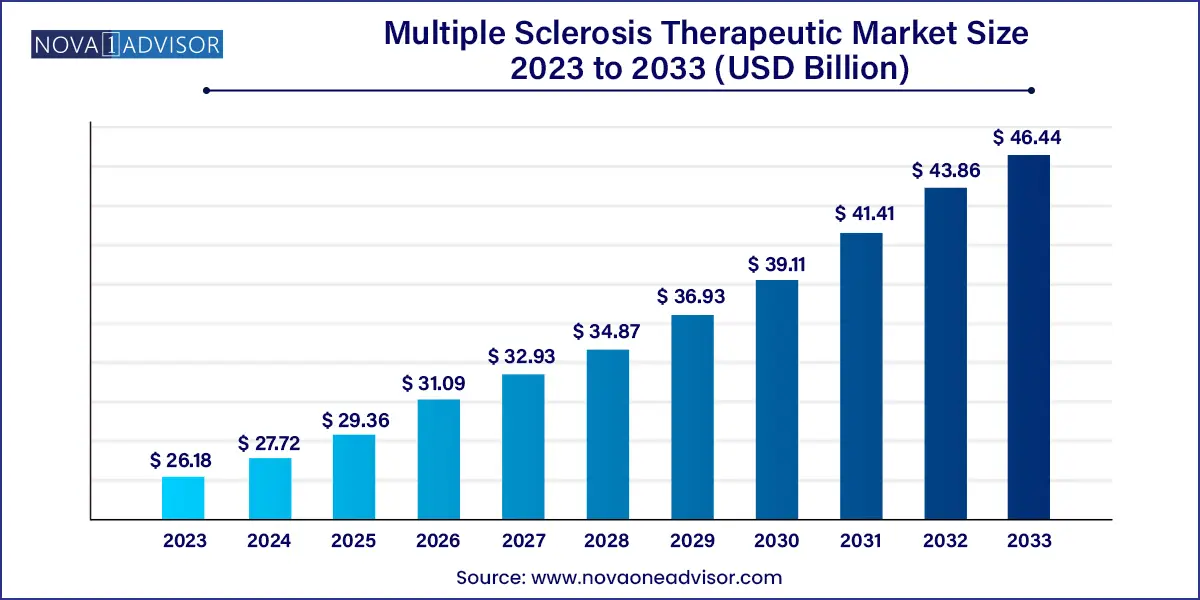
The global multiple sclerosis therapeutic market size was valued at USD 26.18 billion in 2023 and is anticipated to reach around USD 46.44 billion by 2033, growing at a CAGR of 5.9% from 2024 to 2033.

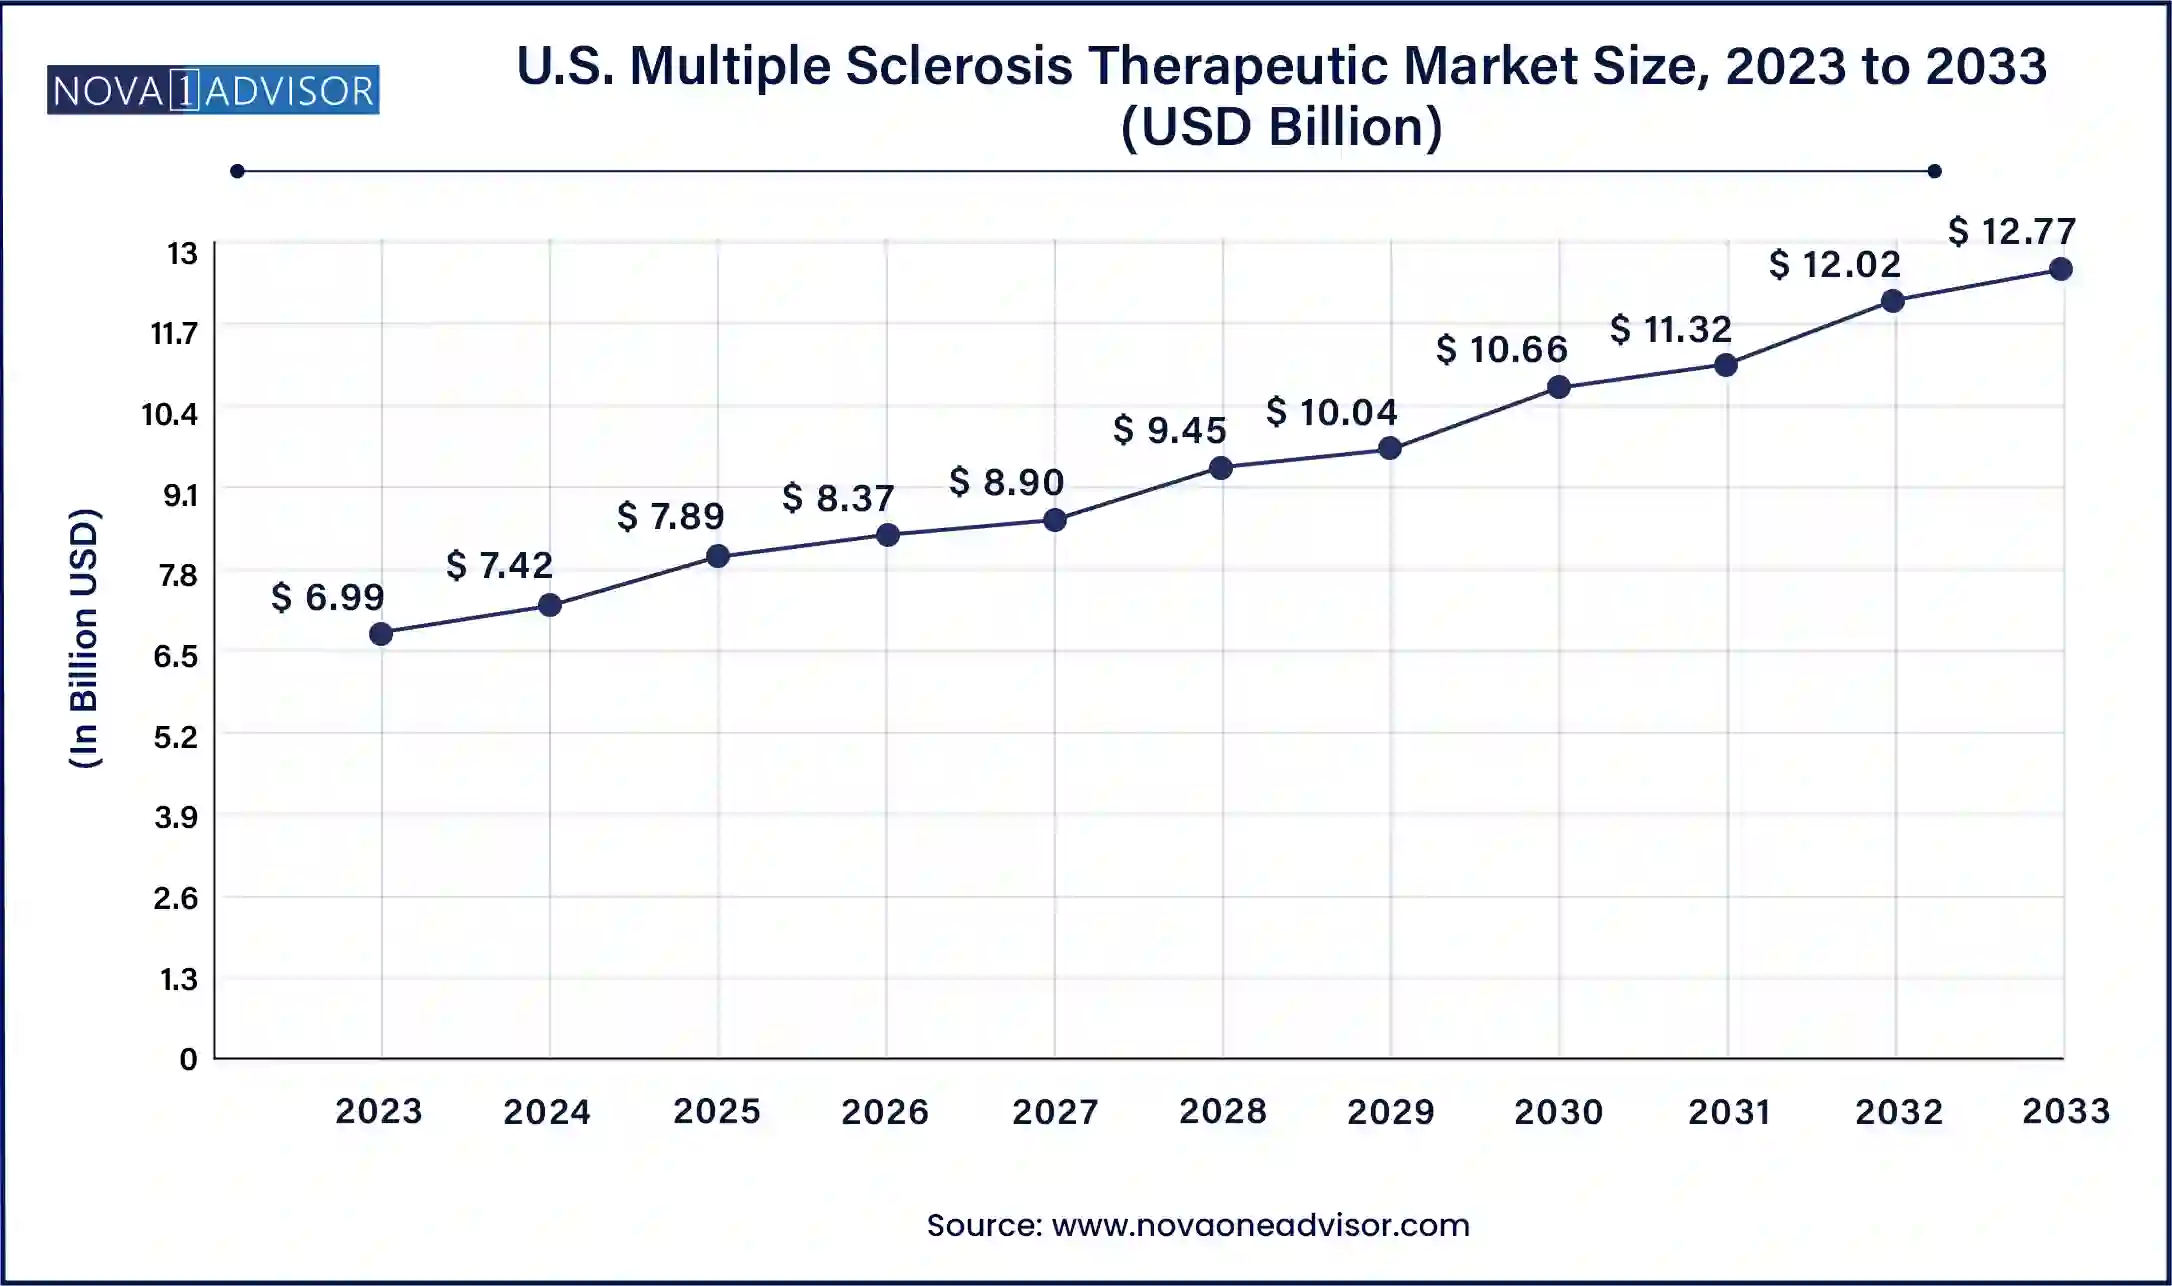
The U.S. multiple sclerosis therapeutic Market size is expected to be worth around USD 12.77 Billion by 2033 from USD 6.99 Billion in 2023, growing at a Compound Annual Growth Rate (CAGR) of 6.2% during the forecast period from 2024 to 2033.

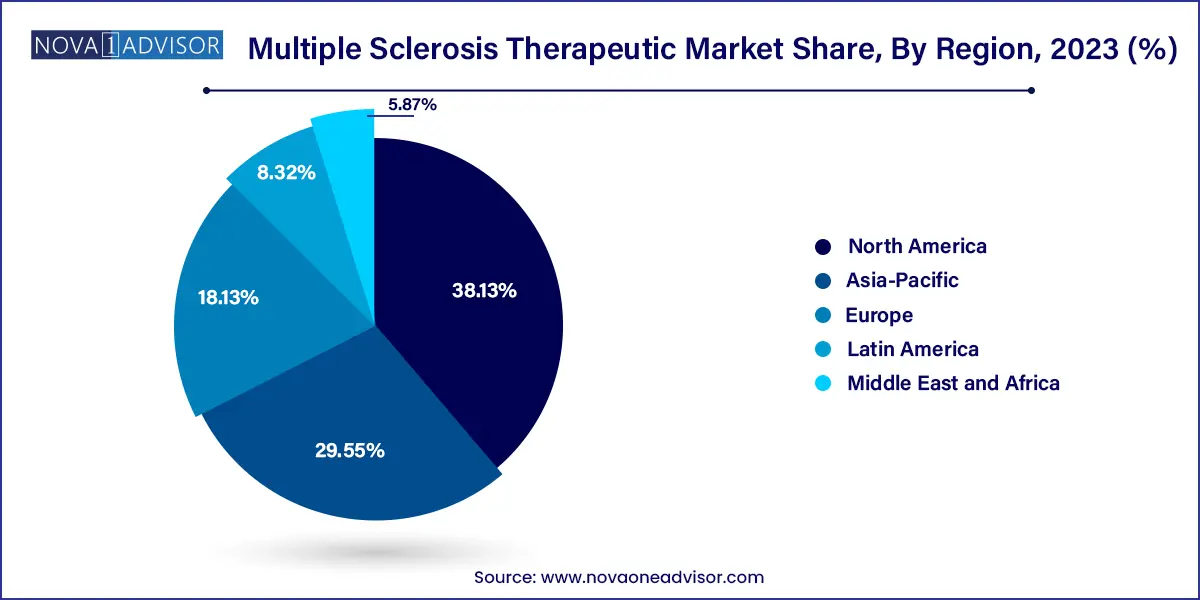
North America dominates the global MS therapeutic market, with the United States holding the lion's share. High disease prevalence, sophisticated healthcare systems, and significant investments in research and development are key factors contributing to the region’s leadership. The presence of leading pharmaceutical players such as Biogen, Novartis, and Bristol Myers Squibb, who actively engage in innovation and commercialization of advanced MS treatments, further strengthens the region’s position. Moreover, patient support initiatives, government funding for neurological disorders, and access to specialty care contribute to higher treatment rates. For instance, the National MS Society in the U.S. plays a vital role in creating awareness, advocating for patient rights, and funding research, thereby fostering market growth.

Asia-Pacific is the fastest-growing regional market, attributed to rising MS awareness, expanding diagnostic capabilities, and supportive healthcare reforms. While MS incidence in this region has historically been lower than in Western countries, recent studies show a steady uptick in diagnoses due to better surveillance and screening programs. Countries such as China, India, and South Korea are focusing on affordable treatment access and increasing their clinical trial capabilities. For example, China’s “Healthy China 2030” plan includes initiatives to improve care for chronic and neurological diseases, indirectly boosting the MS therapeutics market. The rapid adoption of digital health platforms and telemedicine also bridges the gap in care accessibility, enhancing growth prospects across urban and rural populations.
Multiple sclerosis (MS) is a chronic, autoimmune disorder that targets the central nervous system (CNS), primarily affecting the brain and spinal cord. It is characterized by the immune system erroneously attacking the protective sheath (myelin) covering nerve fibers, which disrupts the communication between the brain and the rest of the body. Over time, this condition can lead to permanent nerve damage and a wide range of neurological symptoms such as fatigue, impaired coordination, visual disturbances, and cognitive difficulties.
The global multiple sclerosis therapeutic market has seen consistent growth, driven by the rising prevalence of MS worldwide, advancements in drug development, and growing awareness of the disease. According to multiple health institutions, MS affects over 2.8 million people globally, with the majority of cases being diagnosed in individuals aged 20 to 40 years. Early diagnosis and a growing portfolio of disease-modifying therapies (DMTs) have substantially altered the MS treatment landscape, extending the quality and longevity of life for many patients.
The therapeutic market for MS comprises various types of treatments, including immunomodulatory and immunosuppressive drugs, aimed at modifying disease progression, alleviating symptoms, and managing relapses. With increasing investments from pharmaceutical giants and a robust pipeline of investigational drugs undergoing clinical trials, the market is expected to witness promising growth over the forecast period.
Shift Towards Oral Therapies: Patients and healthcare providers are showing a preference for oral administration over injectable forms, enhancing compliance and convenience.
Rise in Personalized Medicine: Advances in genomics and biomarkers are pushing MS therapies towards more personalized treatment protocols, tailored to individual patients.
Biologics and Biosimilars Development: Increased interest in monoclonal antibodies and biosimilar development for more effective and targeted MS treatments.
Digital Health Integration: Use of AI-driven diagnostics and telehealth platforms to monitor disease progression and manage medication regimens.
Focus on Remyelination Therapies: Research is intensifying around therapies that can restore or regenerate myelin, offering potential for reversal of symptoms.
Collaborative Research Initiatives: Governments, research institutions, and pharmaceutical companies are entering collaborations to develop innovative MS therapeutics.
Global Regulatory Approvals: Accelerated approvals by regulatory agencies such as the FDA and EMA are facilitating quicker market entry for novel MS drugs.
Increasing Clinical Trials in Emerging Markets: Cost-effectiveness and the need for population diversity are pushing companies to conduct trials in Asia-Pacific and Latin America.
| Report Attribute | Details |
| Market Size in 2024 | USD 27.72 Billion |
| Market Size by 2033 | USD 46.44 Billion |
| Growth Rate From 2024 to 2033 | CAGR of 5.9% |
| Base Year | 2023 |
| Forecast Period | 2024 to 2033 |
| Segments Covered | Drug class, route of administration, distribution channel, region |
| Market Analysis (Terms Used) | Value (US$ Million/Billion) or (Volume/Units) |
| Report Coverage | Revenue forecast, company ranking, competitive landscape, growth factors, and trends |
| Key Companies Profiled | Teva Pharmaceutical Industries Ltd.; Pfizer Inc.; Biogen; Bayer AG; Sanofi; F. Hoffmann-La Roche Ltd; Johnson & Johnson Services, Inc.; Merck & Co., Inc.; Takeda Pharmaceutical Company Limited.; Horizon Therapeutics plc |
Advancements in Disease-Modifying Therapies (DMTs)
One of the most significant drivers of the multiple sclerosis therapeutic market is the continuous advancement in disease-modifying therapies. These treatments not only aim to reduce the frequency and severity of relapses but also slow the progression of disability. DMTs like ocrelizumab (Ocrevus), fingolimod (Gilenya), and dimethyl fumarate (Tecfidera) have dramatically changed the prognosis for MS patients. The introduction of newer-generation DMTs, such as siponimod and cladribine, has further enhanced treatment efficacy by targeting specific immune system pathways. These drugs are more effective and often come with reduced side effects, increasing patient adherence and improving clinical outcomes. Pharmaceutical firms are focusing on developing next-generation DMTs that offer higher specificity, lower immunogenicity, and convenient dosing formats, making them highly attractive in both developed and emerging markets.
High Cost of Treatment and Accessibility Issues
Despite the promising therapeutic advancements, the high cost of MS treatments remains a major hurdle, particularly in low- and middle-income countries. The annual cost of treatment per patient can range from tens to hundreds of thousands of dollars. For instance, newer biologics such as ocrelizumab can cost upwards of $65,000 per year, posing a financial burden even in developed healthcare systems. Limited insurance coverage, high out-of-pocket costs, and lack of access to advanced medical infrastructure further exacerbate the situation. This restricts the adoption of effective therapies and creates disparities in treatment outcomes across different geographies. Moreover, patent protection on several leading drugs delays the entry of cost-effective generics and biosimilars into the market.
Emerging Markets and Expansion of Healthcare Infrastructure
The growing focus on emerging economies, especially in Asia-Pacific and Latin America, presents a lucrative opportunity for MS therapeutics. These regions are witnessing rapid advancements in healthcare infrastructure, increased government spending, and greater awareness of neurological disorders. Countries like India, China, and Brazil have started incorporating MS diagnosis and treatment in public health agendas, offering incentives for clinical trials and faster drug approvals. The expansion of telemedicine and digital health platforms also facilitates remote consultation and treatment, especially in underserved rural areas. Companies entering these markets with affordable therapeutics and patient support programs are likely to gain a competitive edge.
Immunosuppressants dominated the drug class segment, accounting for the highest revenue share. These drugs function by dampening the overactive immune response responsible for attacking myelin. Key immunosuppressive agents include ocrelizumab, mitoxantrone, and cladribine. Their broad immunomodulatory action and effectiveness in reducing disease activity have led to widespread adoption, particularly in relapsing-remitting MS (RRMS). Additionally, newer drugs under this class exhibit better safety profiles, which contributes to their strong market positioning.
On the other hand, immunostimulants are expected to witness the fastest growth during the forecast period. These drugs aim to enhance the body's natural repair mechanisms, especially remyelination. Their application is primarily seen in progressive forms of MS where conventional immunosuppressants show limited efficacy. Ongoing research in immunostimulatory therapies, including stem-cell-based treatments and neuroprotective agents, is projected to expand this segment rapidly. The emergence of novel biologics that support immune regulation rather than suppression also points to the future significance of this category.
Injectable formulations currently dominate the route of administration, primarily due to the legacy of first-line drugs such as interferon beta and glatiramer acetate. These drugs, though gradually being replaced by oral therapies, still maintain a strong presence in clinical practice due to established efficacy and physician familiarity. Additionally, several monoclonal antibody-based treatments continue to be administered intravenously or subcutaneously, reinforcing the dominance of this segment.
However, the oral segment is emerging as the fastest-growing category. Drugs like fingolimod, dimethyl fumarate, and teriflunomide are preferred for their convenience, non-invasive nature, and better patient compliance. Oral administration reduces the need for regular clinic visits and enhances treatment adherence, particularly for younger demographics. The ongoing development of next-generation oral DMTs with improved tolerability profiles is expected to propel this segment further.
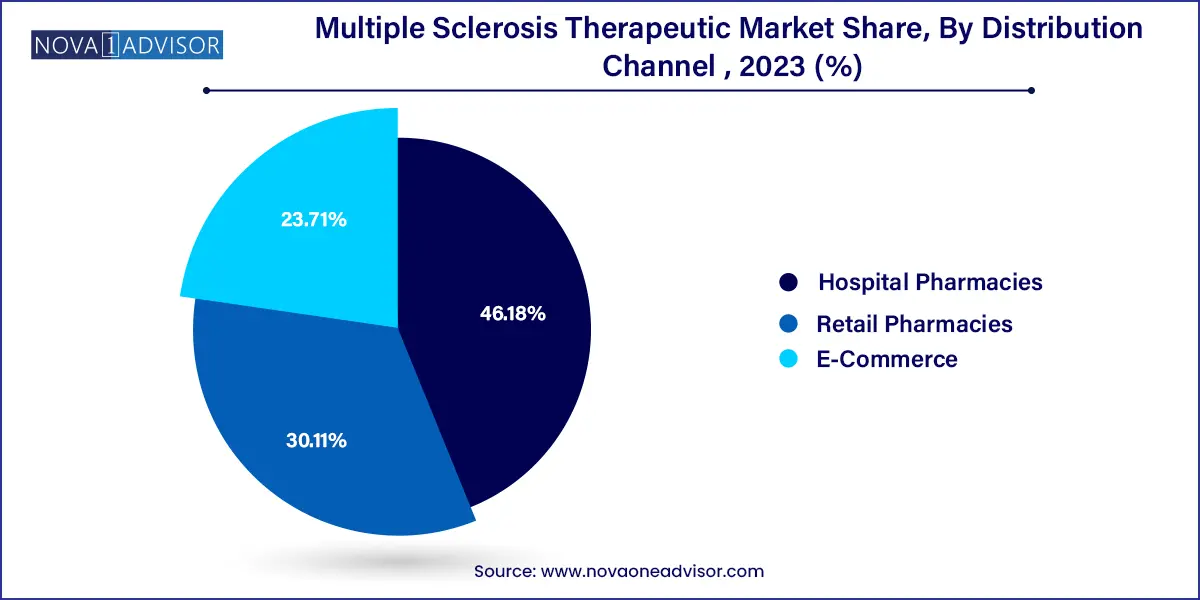
Hospital pharmacies lead the distribution channel segment, driven by the fact that most MS drugs, especially biologics and injectable therapies, are administered under medical supervision. Hospitals are often the first point of diagnosis and treatment, making them the primary procurement centers for MS medications. Moreover, their ability to manage storage conditions, handle insurance reimbursements, and monitor adverse effects ensures continued reliance on this channel.

Conversely, e-commerce is projected to grow at the fastest rate, especially post-pandemic. Patients are increasingly opting for home delivery of maintenance medications. Online pharmacies offer cost benefits, subscription-based services, and door-step delivery—features that resonate well with long-term MS management. The digital transformation of healthcare, combined with the rise in e-prescriptions and virtual consultations, is expected to bolster the online pharmaceutical supply chain for MS drugs.
The following are the leading companies in the multiple sclerosis therapeutic market. These companies collectively hold the largest market share and dictate industry trends.
January 2025: Biogen announced the expansion of its manufacturing facility in Switzerland to increase the production capacity of MS drugs, particularly Tysabri and Tecfidera, anticipating higher demand in Europe and Asia.
October 2024: Bristol Myers Squibb received FDA approval for its MS drug Zeposia (ozanimod) for a broader patient population, including those with early-stage disease progression.
August 2024: Novartis launched a new global patient support initiative titled “MS FutureCare” to assist patients in low-income regions with free drug samples and educational resources.
June 2024: Roche initiated Phase III clinical trials for their new remyelination-focused biologic therapy aimed at secondary progressive MS patients, marking a shift towards curative treatment research.
May 2024: Teva Pharmaceuticals entered a strategic partnership with an Indian biotech firm to develop low-cost biosimilars of leading MS drugs for the Asia-Pacific market.
This report forecasts revenue growth at country levels and provides an analysis of the latest industry trends in each of the sub-segments from 2021 to 2033. For this study, Nova one advisor, Inc. has segmented the Multiple Sclerosis Therapeutic market.
By Drug Class
By Route of Administration
By Distribution Channel
By Region