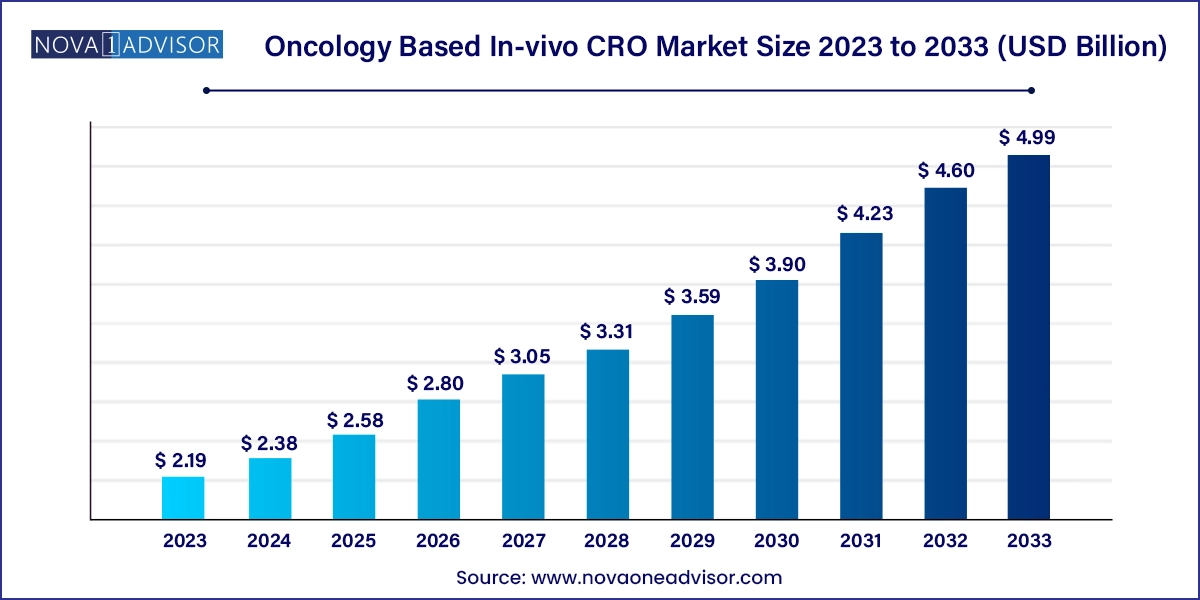
The global oncology based In-vivo CRO market size was valued at USD 2.19 billion in 2023 and is anticipated to reach around USD 4.99 billion by 2033, growing at a CAGR of 8.59% from 2024 to 2033.

The Oncology-Based In-vivo Contract Research Organization (CRO) Market represents one of the most sophisticated and dynamically evolving sectors within the broader clinical research ecosystem. As cancer remains a leading cause of mortality globally, the demand for novel therapeutics, biologics, and precision-targeted drugs continues to rise. In-vivo CROs that specialize in oncology play a critical role in supporting preclinical testing, efficacy analysis, toxicity profiling, and translational research, bridging the gap between discovery and first-in-human trials.
The use of in-vivo models in oncology particularly mouse models, xenografts, and patient-derived xenografts (PDXs) has transformed how pharmaceutical and biotechnology companies screen drug candidates, validate targets, and optimize dosing strategies. These models replicate tumor biology with high fidelity, allowing researchers to simulate the complexities of human cancer in a controlled environment. With oncology drug development requiring extensive testing due to high failure rates and complexity, outsourcing in-vivo studies to CROs has become a strategic imperative.
The global oncology drug pipeline is robust, with thousands of compounds in various stages of development. This boom in research, coupled with pressures to reduce development timelines and costs, has propelled the demand for specialized in-vivo CROs that offer scientific rigor, scalability, and regulatory compliance. Furthermore, the adoption of personalized oncology approaches, such as immunotherapies and cell-based treatments, is further accelerating the need for relevant animal models and CROs with domain expertise.
Surging demand for patient-derived xenografts (PDXs): PDX models offer high translational relevance and are increasingly used to predict clinical outcomes.
Expansion of immuno-oncology studies: CROs are adapting syngeneic models to assess T-cell response and checkpoint inhibitor efficacy.
Integration of AI and digital pathology: Data analytics tools are being used to enhance tumor response evaluation and biomarker discovery.
Customized model development: Demand is rising for custom-generated orthotopic, metastatic, and humanized mouse models.
Strategic CRO partnerships with biotech startups: Biotechs with limited in-house resources are leveraging CROs for full-service preclinical programs.
Decentralization and global site expansion: CROs are establishing animal research facilities in Asia-Pacific and Eastern Europe to optimize costs.
Regulatory pressure for reproducibility and data transparency: Compliance with GLP, OECD guidelines, and FDA 21 CFR Part 11 is being emphasized.
| Report Attribute |
Details |
| Market Size in 2024 | USD 2.38 Billion |
| Market Size by 2033 | USD 4.99 Billion |
| Growth Rate From 2024 to 2033 | CAGR of 8.59% |
| Base Year | 2023 |
| Forecast Period | 2024 to 2033 |
| Segments Covered | Indication, region |
| Market Analysis (Terms Used) | Value (US$ Million/Billion) or (Volume/Units) |
| Report Coverage | Revenue forecast, company ranking, competitive landscape, growth factors, and trends |
| Key Companies Profiled | Charles River Laboratory (CRL), ICON Plc, Thermo Fisher Scientific Inc., Eurofins Scientific, Taconic Biosciences, Crown Bioscience, Laboratory Corporation of America Holdings, WuXi AppTec, EVOTEC, The Jackson Laboratory |
A central driver for the oncology-based in-vivo CRO market is the escalating complexity of oncology drug pipelines, particularly in targeted therapies, combination regimens, and immuno-oncology agents. Oncology accounts for the largest share of the global drug development pipeline, with over 30% of all active clinical trials being cancer-related.
Each of these therapeutic approaches requires different animal models, dose optimization strategies, and immunocompatibility testing. For example, immune checkpoint inhibitors need fully immunocompetent models like syngeneic mice, while ADCs (antibody-drug conjugates) require models that mirror human antigen expression.
To navigate these complexities, biopharma companies are turning to CROs that can offer a diverse portfolio of in-vivo models—from genetically engineered mice to orthotopic PDX models and deliver customized protocols for pharmacokinetics, tumor growth inhibition, histopathology, and biomarker correlation.
This complexity increases outsourcing demand, as in-house research teams often lack the infrastructure and technical depth to manage such multifaceted in-vivo programs efficiently.
Despite strong demand, a major restraint in this market is the ethical, regulatory, and logistical challenges associated with in-vivo animal research. The use of animal models particularly rodents raises significant ethical considerations related to animal welfare, pain management, and scientific justification.
Stringent regulations such as EU Directive 2010/63, the U.S. Animal Welfare Act, and Good Laboratory Practices (GLP) necessitate comprehensive documentation, facility certifications, and ethical review board approvals, increasing overhead and compliance complexity for CROs.
Moreover, public scrutiny of animal testing, along with pressure from advocacy groups, has intensified demand for 3Rs (Replacement, Reduction, Refinement) principles. This pressure may limit model selection flexibility or prolong protocol approval timelines.
As a result, CROs must invest in facility upgrades, trained personnel, and alternative in-vitro or ex-vivo techniques to maintain market competitiveness and ethical transparency.
The most significant growth opportunity lies in the emergence of precision and personalized oncology, which is pushing CROs to develop humanized mouse models, patient-derived xenografts (PDXs), and avatar models.
With tumor heterogeneity now recognized as a key determinant of treatment success or failure, there is strong demand for preclinical models that can mimic individual patient tumor profiles, immune responses, and genetic backgrounds. PDX models derived from biopsy or surgical samples allow sponsors to assess drug response in clinically relevant contexts.
Humanized mice—engineered to express human immune components are enabling advanced immuno-oncology research, including CAR-T and TCR therapies. These models allow developers to test efficacy, cytokine response, and safety of immune-targeted agents before first-in-human studies.
CROs offering these advanced platforms stand to capture long-term contracts with top-tier pharma and biotech companies, especially as these models become a standard requirement in oncology IND-enabling packages.
Solid tumors dominate the oncology in-vivo CRO market, accounting for the majority of preclinical research activity. Solid tumors such as breast, lung, colon, prostate, and pancreatic cancers are extensively modeled using xenografts, orthotopic injections, and PDXs. Xenografts in immunodeficient mice are preferred for high-throughput screening of cytotoxic and targeted agents. Meanwhile, orthotopic models better replicate the tumor microenvironment and metastatic behavior. The widespread prevalence and heterogeneity of solid tumors ensure sustained CRO demand.
Patient-derived xenografts (PDXs) for solid tumors are the fastest-growing segment, as they offer high translational value and are often used for biomarker discovery, drug response prediction, and combination studies. As next-gen sequencing becomes cheaper and tumor biobanks expand, CROs are developing large PDX libraries, enabling clients to select models based on mutation status, drug resistance, or molecular subtype.
Blood cancers also hold a significant share, particularly in the development of monoclonal antibodies, bispecifics, and cell therapies. Models for acute myeloid leukemia (AML), lymphomas, and multiple myeloma are typically established using xenografts in NOD-SCID or NSG mice. CAR-T cell therapies are tested in these models to assess persistence, expansion, and tumor clearance.
Syngeneic models are especially critical for immuno-oncology applications, as they allow the study of host immune response. These models are predominantly used in murine solid tumor lines like B16 (melanoma) or 4T1 (breast cancer). CROs offering CRISPR-edited syngeneic models with defined neoantigens are increasingly in demand.
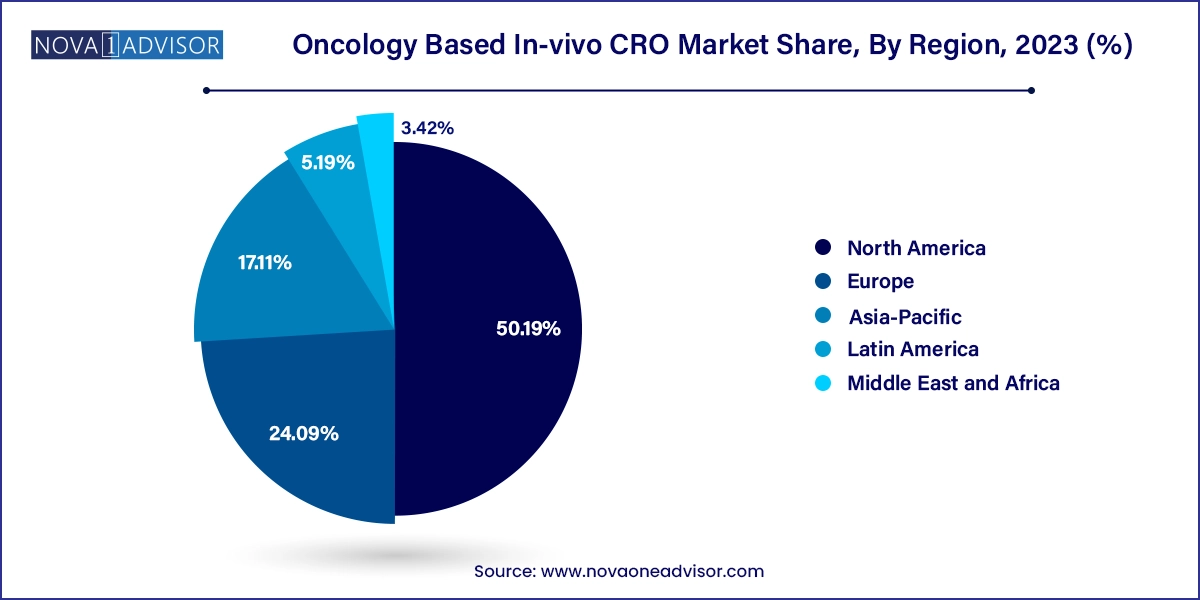
North America dominates the global oncology in-vivo CRO market, driven by its advanced biomedical infrastructure, high R&D investment, and presence of leading pharmaceutical companies. The U.S. alone accounts for over 45% of global oncology trials, and preclinical CROs such as Charles River Laboratories, Labcorp Drug Development, and The Jackson Laboratory have extensive facilities offering GLP-compliant oncology services.
Government programs like Cancer Moonshot, NIH grants, and FDA fast-track designations have also increased demand for outsourced preclinical services. The region also benefits from strong regulatory frameworks that support model validation and ethical research.

Asia-Pacific is the fastest-growing region, fueled by cost advantages, talent availability, and government support for biotech innovation. Countries like China, India, and South Korea are experiencing a CRO boom, with companies like WuXi AppTec and Syngene International investing in large-scale in-vivo testing infrastructure.
Additionally, as local biopharma companies emerge with global ambitions, demand for indigenized oncology models and local regulatory pathways is creating new service niches. The region is also investing in genetically engineered and humanized mouse model colonies to support precision oncology research.
This report forecasts revenue growth at country levels and provides an analysis of the latest industry trends in each of the sub-segments from 2021 to 2033. For this study, Nova one advisor, Inc. has segmented the Oncology Based In-vivo CRO market.
By Indication
By Region