Ophthalmic Drugs Market Size, Share & Trends Analysis Report By Drug Class (Steroidal drugs, Anti-VEGF Agents), By Disease, By Dosage Form, By Route of Administration, By Product Type, By Product, By Region)- Global Industry Analysis, Size, Share, Growth, Trends, Regional Outlook, and Forecast 2024-2033

Ophthalmic Drugs Market Size and Growth

The global ophthalmic drugs market size was valued at USD 41.65 billion in 2023 and is projected to surpass around USD 70.07 billion by 2033, registering a CAGR of 5.34% over the forecast period of 2024 to 2033.
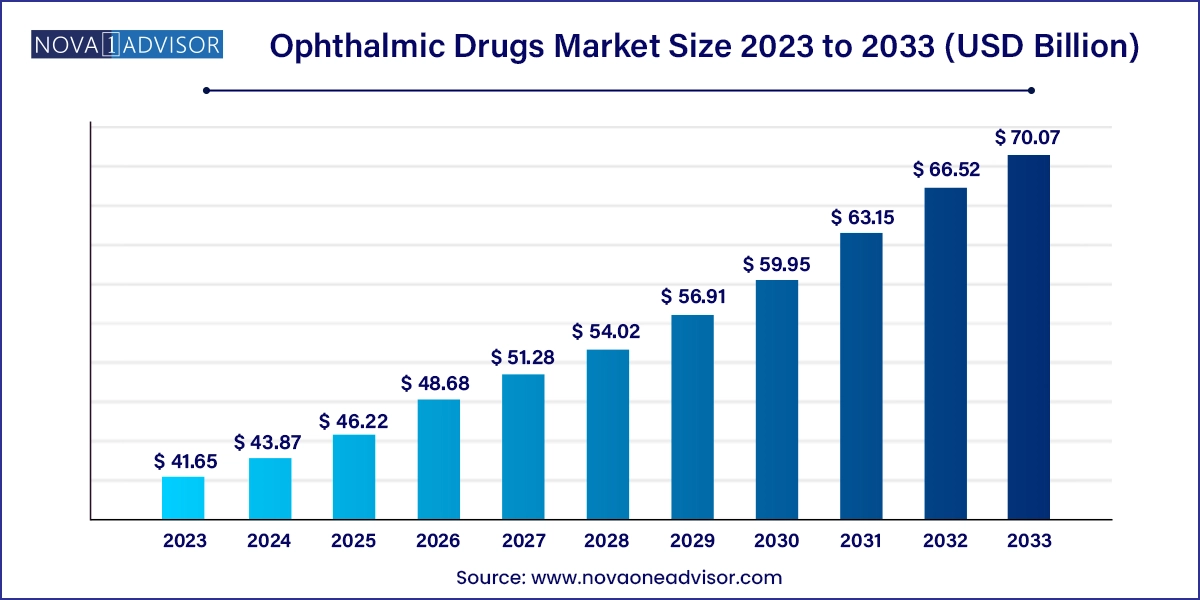
Ophthalmic Drugs Market Size, 2024 to 2033

Ophthalmic Drugs Market Key Takeaways

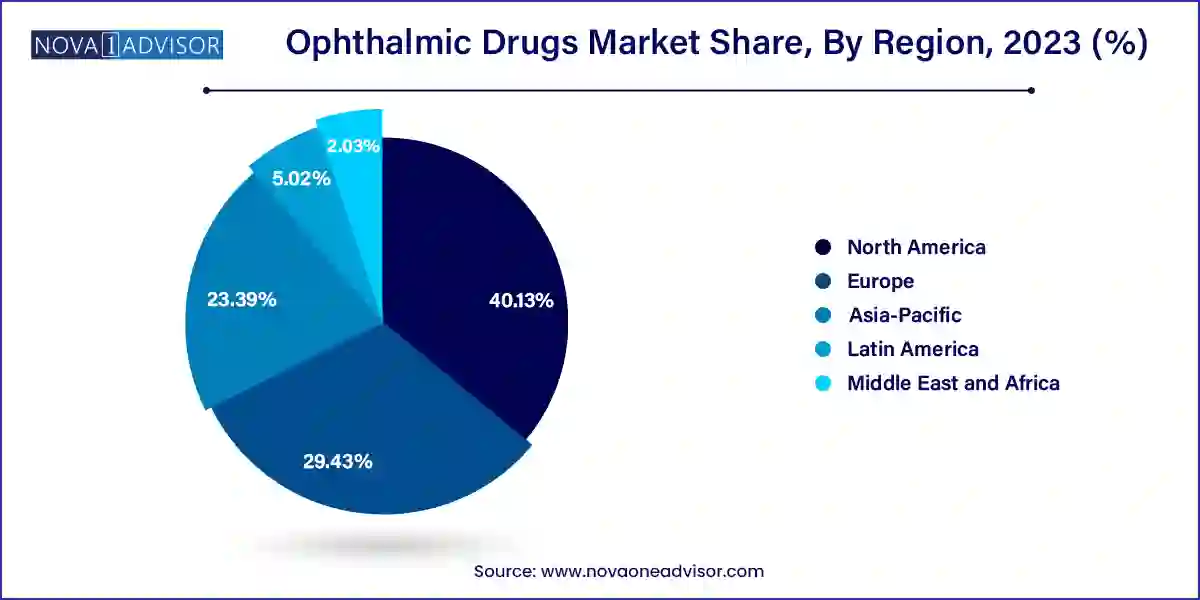
  • North America dominated the market and accounted for a 40.13% share in 2023.
  • Asia Pacific is anticipated to witness the fastest growth rate.
  • Anti-VEGF agents led the market and accounted for 33.01% of the global revenue in 2023.
  • Gene and cell therapy segment is anticipated to grow at the fastest growth rate over the forecast period.
  • Retinal disorders led the market in 2023 and are anticipated to grow at the fastest growth rate over the forecast period.
  • Infection segment is anticipated to grow at lucrative growth over the forecast period.
  • Topical route of administration led the market in 2023.
  • Local ocular route of administration segment is anticipated to grow at the fastest growth rate over the forecast period.
  • Eye drops led the market in 2023 and are anticipated to grow at the fastest growth rate over the forecast period.
  • The eye solutions & suspensions segment is anticipated to grow at lucrative growth rate over the forecast period.
  • Prescription drugs led the market in 2023.
  • OTC drugs are anticipated to grow at the fastest growth rate over the forecast period.
  • Branded drugs dominated the market in 2023 due to the growing need for novel therapies and treatments.
  • The generic drugs segment is projected to witness the fastest growth rate over the forecast period.

U.S. Ophthalmic Drugs Market Size and Growth 2024 to 2033

The U.S. ophthalmic drugs market size was estimated at USD 11.89 billion in 2023 and is projected to hit around USD 21.03 billion by 2033, growing at a CAGR of 5.87% during the forecast period from 2024 to 2033.
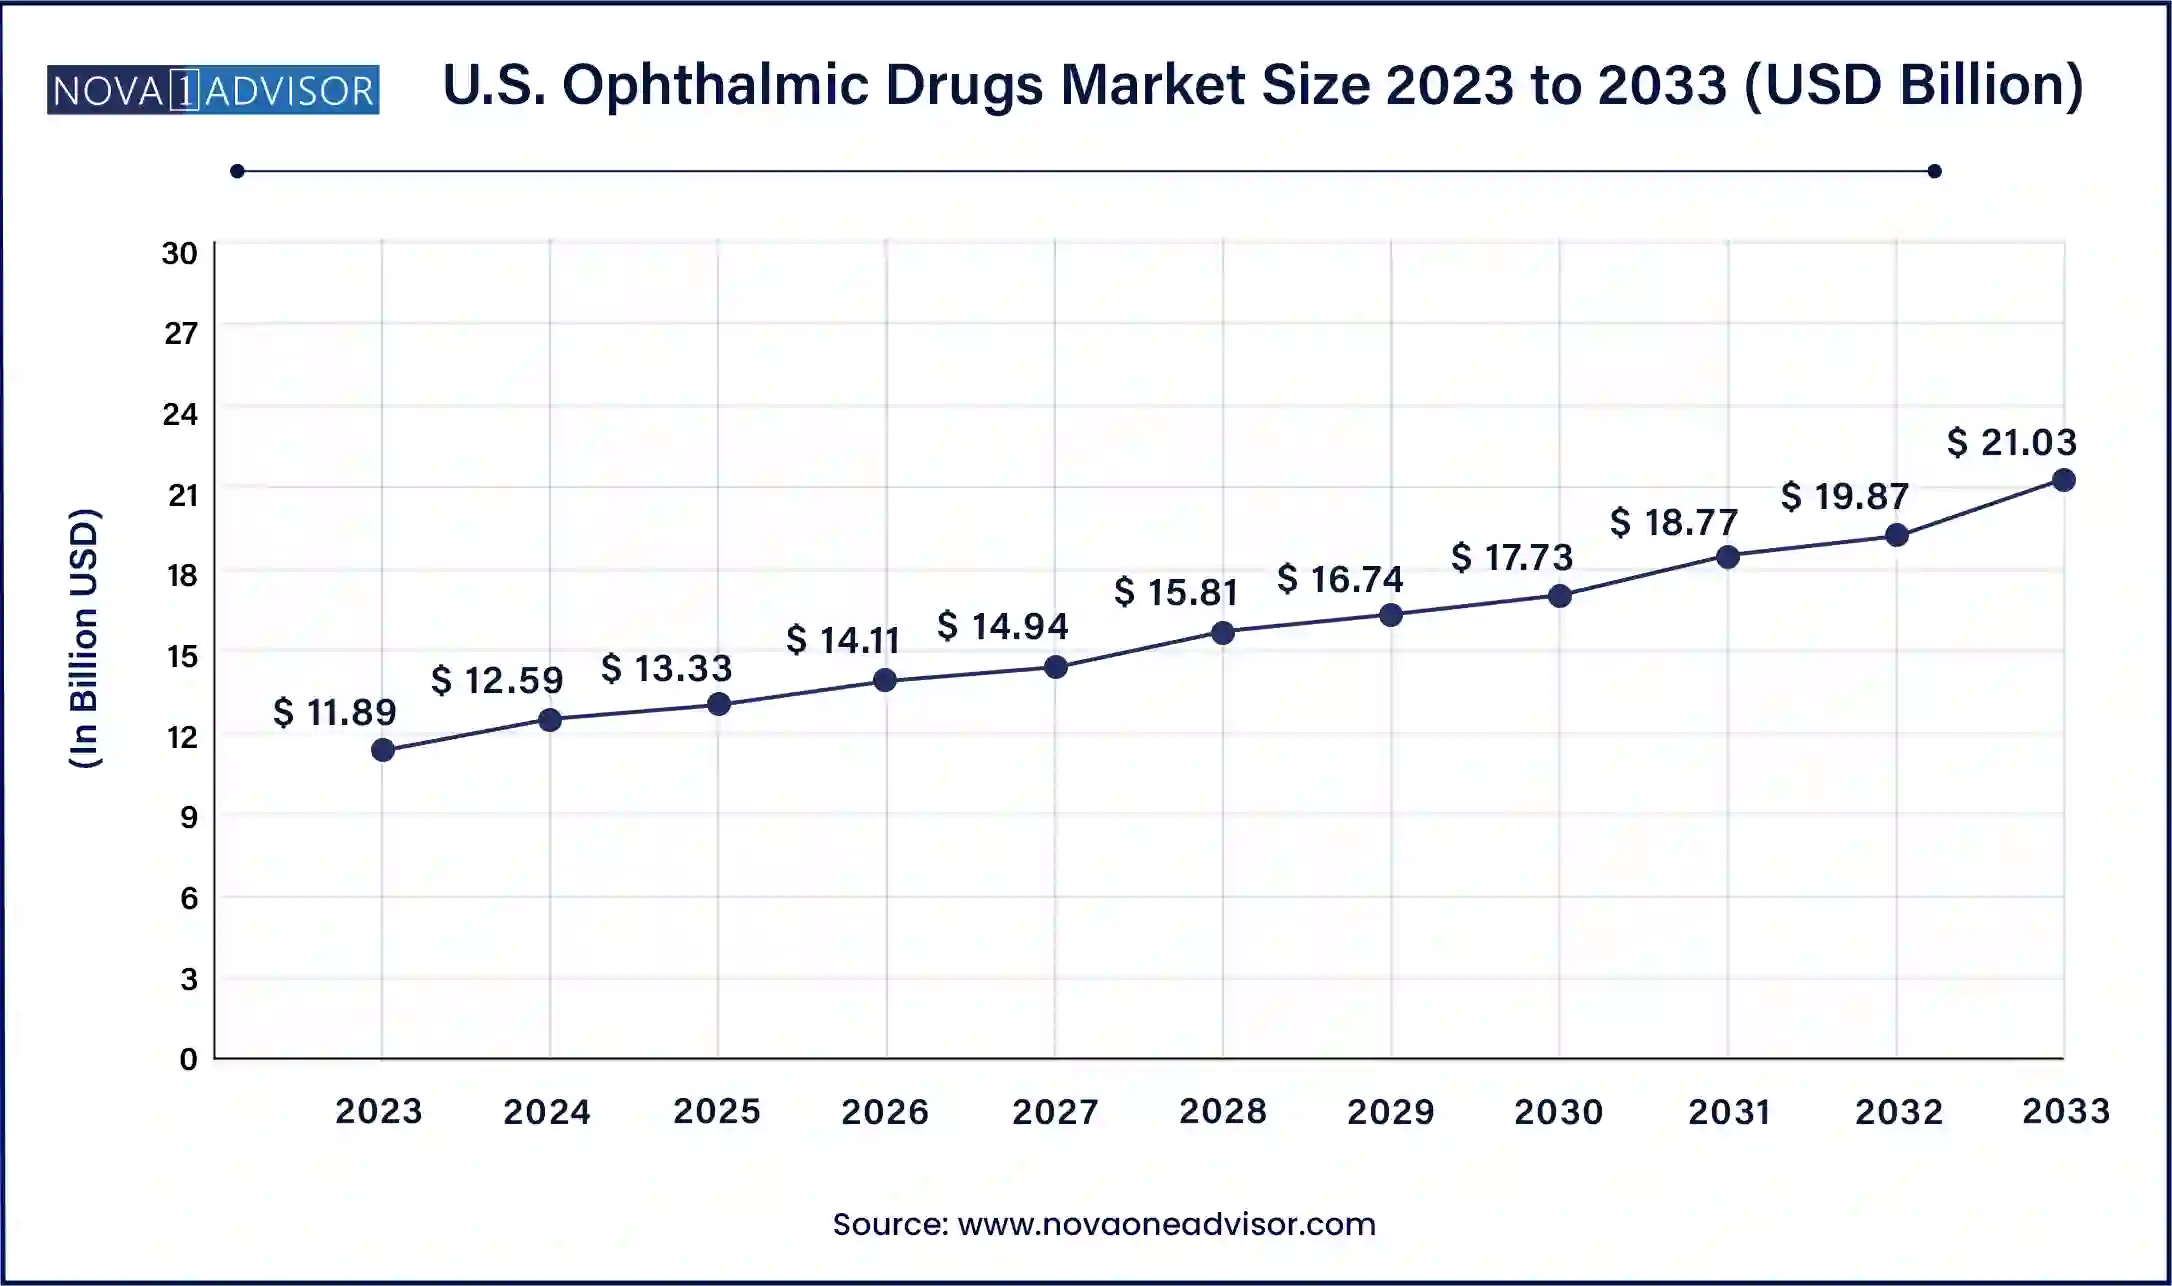
U.S. Ophthalmic Drugs Market Size, 2024 to 2033

North America dominated the market and accounted for a 40.13% share in 2023. This high share is owing to the rising prevalence of retinal diseases and favorable government initiatives in the region. North America is a developed region with high healthcare expenditure. The local presence of regulatory entities in North American countries is expected to boost the development of ophthalmic drugs in the near future. This is mainly because these entities play a pivotal role in creating awareness among people about the potential of dry eye treatment therapies in disease management. Moreover, the high prevalence and increasing eye treatment procedures aid expansion in the region.

U.S. Ophthalmic Drugs Market Size, 2024 to 2033

Asia Pacific is anticipated to witness the fastest growth rate. The increasing burden of ophthalmic disorders and rising consumer awareness are expected to drive market growth in Asia Pacific. Nearly two-thirds of the Asia Pacific population is vision impaired or blind. Moreover, the development of various novel technologies by research institutes in developing economies, such as China and India, is expected to improve healthcare facilities in the region. The presence of a well-distributed network of clinical laboratories and hospitals in India is enabling an improved market penetration of ophthalmic drugs.Furthermore, developed countries in the region, such as Australia, are approving the entry of new treatments such as Cationorm emulsion into the market.

Ophthalmic Drugs Market Growth 

The market growth is attributed to rising prevalence of retinal disorders, advancement in drug delivery, and an increasing focus on research for development of novel therapeutics in the market. Moreover, increasing investment by public and private organizations is further propelling the growth of market. For instance, in July 2023, the National Eye Institute announced a funding of USD 2.5 million for over 5 years to advance the glaucoma treatment research at Missouri University of Science and Technology.

Increase in the prevalence of eye-related disorders, such as macular degeneration, diabetic retinopathy, and presbyopia, is one of the major factors driving the growth of the overall market. The increasing prevalence of these conditions is expected to boost the market. As per WHO, in 2019, approximately 2.2 billion people were visually impaired globally. In addition, over 39 million were blind, nearly 188.5 million people were suffering from mild vision impairment, and over 217 million people experienced moderate-to-severe vision impairment.

Drug delivery to the human eye is rapidly expanding but is challenging for the pharmaceutical industry. With the introduction of genes and other innovative medicines, the adoption of ocular injectable drugs is rapidly increasing. Nonetheless, topicals (mainly liquids including solutions and suspensions, but also semi-solids) continue to be the most common dosage form for ophthalmic commercialized and in-development medicines. For each molecule under development, it is determined whether the medicine has the potential to significantly improve the lives of people suffering from a vision-threatening disease. Key players operating in the market offer medications to patients and are continually focusing on adopting innovative technologies that can help provide relief as well as improve the quality of life of people.

Despite the availability of approved medicines, there is still an unmet need and an opportunity to provide alternative therapeutic options to help patients better control their ophthalmic disease by presenting a novel option with a different mechanism of action than currently existing medications. Moreover, key players operating in the market are constantly focusing on the development and launch of novel therapeutics with an enhanced drug delivery system, which is anticipated to provide opportunities for market growth.

Changes in vision and the increasing necessity for corrective devices can be troubling for a patient with nascent presbyopia. Both spectacle and contact lenses can correct near vision acuity, but they must be cared for and maintained. With a rapidly aging population and people becoming increasingly reliant on multiscreen devices, the burden of retinal disease is anticipated to increase in the future.

Ophthalmic Drugs Market Report Scope

Report Attribute Details
Market Size in 2024 USD 43.87 Billion
Market Size by 2033 USD 70.07 Billion
Growth Rate From 2024 to 2033 CAGR of 5.34%
Base Year 2023
Forecast Period 2024 to 2033
Segments Covered Drug class, disease, route of administration, dosage form, product type, product, region
Market Analysis (Terms Used) Value (US$ Million/Billion) or (Volume/Units)
Report Coverage Revenue forecast, company ranking, competitive landscape, growth factors, and trends
Key Companies Profiled Pfizer Inc.; Alcon; Novartis AG; Bausch Health Companies Inc.; Merck & Co., Inc.; Regeneron Pharmaceuticals Inc.; Allergan (AbbVie Inc); Bayer AG; Genentech, Inc. (F. Hoffmann-La Roche Ltd); Nicox; Coherus Biosciences, Inc.

Ophthalmic Drugs Market By Drug Class Insights

Anti-VEGF agents led the market and accounted for 33.01% of the global revenue in 2023. The segment growth is attributed to the rising prevalence of retinal disorders globally. This is anticipated to propel the sales of anti-VEGF agents, boosting segment growth. These agents are useful in ophthalmology for treating eye conditions that cause swelling or growth of new blood vessels around the retina. Moreover, increasing research activities related to anti-VEGF drugs for different ophthalmic disorders are improving the introduction of novel drugs in the market. In February 2023, Bayer AG submitted a regulatory approval application to the European Medicines Agency (EMA) for aflibercept 8 mg for neovascular (wet) age-related macular degeneration (nAMD) and diabetic macular edema (DME).

Gene and cell therapy segment is anticipated to grow at the fastest growth rate over the forecast period. Gene & cell therapy is a comparatively newer therapeutic option for treating eye diseases. The increasing adoption of these products due to high efficacy and effectiveness of drugs is expected to drive the segment growth significantly. Moreover, the increasing product approval and service providers in the market are driving segment growth. For instance, OHSU Casey Eye Institute is offering gene therapy treatment for people with inherited retinal disease due to mutation in both copies of RPE65 gene.

Ophthalmic Drugs Market By Disease Insights

Retinal disorders led the market in 2023 and are anticipated to grow at the fastest growth rate over the forecast period. Growing incidence of retinal disorders around the globe and the need for effective and affordable treatment options for the same has driven the market. The National Eye Institute estimated that by 2050 and 2033, around 14 and 10 million people respectively will suffer from diabetic retinopathy in America. The leading drugs for treating retinal disorders are Lucentis, Eylea, and Avastin. Moreover, Platelet-Derived Growth Factor (PDGF) therapy is anticipated to be the new revolution in treating retinal disorders.

Infection segment is anticipated to grow at lucrative growth over the forecast period. The growth of the segment is attributed to the rising prevalence of eye infections. Bacterial conjunctivitis is one of the most prevalent ophthalmic infections. According to an article published by WebMD LLC., in 2019, conjunctivitis affects 6 million people in the U.S. annually and accounts for 1% of the total primary care office visits. Moreover, 30% of patients with conjunctivitis have bacterial conjunctivitis, and 80% of them are treated with antibiotics. Medications used to treat conjunctivitis typically include broad-spectrum antibiotics as the first line of treatment.

Ophthalmic Drugs Market By Route of Administration Insights

Topical route of administration led the market in 2023. Topical drug dosage forms generally include suspensions, solutions, and ointments. The cornea is the primary route of topical absorption that poses significant anatomical barriers. Availability of several drugs delivered via topical route of administration is estimated to be the major driver of this segment. For instance, phenylephrine, tetrahydrozoline, oxymetazoline, and naphazoline are currently available in the market as OTC ophthalmic decongestants. The topical use of oxymetazoline is generally indicated for improving symptoms such as itching, burning, and tearing associated with allergic conjunctivitis.

Local ocular route of administration segment is anticipated to grow at the fastest growth rate over the forecast period. Intraocular delivery route facilitates direct entry of drugs into blood retinal barrier and, therefore, the highest peak of drug concentration can be achieved. It achieves maximum intraocular bioavailability in posterior segment tissues of the eye, such as cone-containing fovea or macula. However, this is the most invasive route of administration, involving penetration of drugs in the eye and, thus, is not free of injection-related complications. These may include retinal hemorrhage, raised IOP, floaters, transient blurry vision, vitreous hemorrhage, retinal tears, retinal detachment, endophthalmitis, and cataracts.

Ophthalmic Drugs Market By Dosage Type Insights

Eye drops led the market in 2023 and are anticipated to grow at the fastest growth rate over the forecast period. Eye drops are the most preferred form of drug delivery used for treating ocular diseases such as acute allergies, corneal ulcers, and glaucoma. Eye drops are relatively cost-effective compared with other forms of dosage. For example, azithromycin, besifloxacin, timolol eye drops, besivance (besifloxacin hydrochloride—suspension/drops; ophthalmic). Alcon and Bausch & Lomb are some of the leading companies in ophthalmic eye drops market. Moreover, owing to increasing usage and rising prevalence of various eye-related diseases, there is an increasing demand for ophthalmic drugs.

The eye solutions & suspensions segment is anticipated to grow at lucrative growth rate over the forecast period. Eye solutions facilitate direct drug delivery, which is a distinct clinical advantage. Some of the most commonly used eye solutions include Moxeza, Ocuflox, and Neosporin. Eye solutions may also contain certain excipients to regulate viscosity, pH, and osmotic pressure. Presence of advanced technology for drug delivery in order to improve physicochemical stability & bioavailability is anticipated to boost the market growth. For instance, in January 2022, Sun Pharma launched its cyclosporine ophthalmic solution, CEQUA 0.09%, a novel treatment for DED affecting over 6 million Canadians living with the condition.

Ophthalmic Drugs Market By Product Type Insights

Prescription drugs led the market in 2023. Prescription medications are the major reason for increased healthcare spending. According to studies published by American Academy of Ophthalmology, in 2018, eye care providers including optometrists and ophthalmologists accounted for around USD 2.4 billion out of the total USD 103 billion Medicare Part D costs for prescription drugs and, thus, produced the highest percentage of claims for brand medications among all other specialties. Support from various private & public authorities to increase sales of prescription medicines is anticipated to boost segment growth. In May 2023, the U.S. FDA approved Bausch & Lomb and Novaliq’s Miebo for treating DED. It is the first & only prescription drop to receive the U.S. FDA approval for DED.

OTC drugs are anticipated to grow at the fastest growth rate over the forecast period. The growth of the segment is attributed to the increasing penetration of generics in the market aided by the loss of patent exclusivities of major drugs. The relatively low cost of these drugs makes it affordable for a large patient base in low- and middle-economic countries. OTC drugs for ophthalmic use have anti-inflammatory, anti-infective, and antibiotic properties. They are commercially available in various dosage forms including emulsions, capsules, ointment, gels, and drops. Some of the top-selling ophthalmology OTC products include Otrivine-Antistin (Novartis Consumer Health); Alaway (Bausch & Lomb, Inc.); Golden Eye Ointment (Sigma Pharmaceuticals); Zaditor (Alcon, Inc.); Brolene (Sanofi); GelTears (Bausch & Lomb); and Viscotears (Alcon, Inc.).

Ophthalmic Drugs Market By Product Insights

Branded drugs dominated the market in 2023 due to the growing need for novel therapies and treatments. Several players are engaged in developing new treatments for various conditions, such as dry eye and glaucoma, as current treatments are known to provide temporary symptomatic relief. Hence, companies are developing long-acting, hands-free therapies to combat such challenges. In addition, ophthalmic pharmaceutical companies are entering into strategic initiatives, such as collaborations, acquisitions, and partnerships, to expand their product pipeline with new clinical-stage candidates, which is expected to boost the market.

Ophthalmic Drugs Market Share, By Product, 2023 (%)

The generic drugs segment is projected to witness the fastest growth rate over the forecast period. Cost-effectiveness and patent expiry of branded drugs are some of the key factors supporting segment growth. Moreover, the generic drug is similar to an existing approved brand name drug in terms of safety, dosage form, route of administration, quality, strength, and performance characteristics. However, the cost of generics is low, which provides an advantage to generic drugs for more prescription, especially in developing economies. Moreover, government bodies are motivating drug manufacturers to increase the development of generic drugs as they are top-selling ophthalmology drugs. For instance, in September 2021, the U.S. FDA approved the first biosimilar to Byooviz (SB-11) for treating multiple eye conditions. Such initiatives are propelling market growth.

Ophthalmic Drugs Market Recent Developments

  • In May 2023, Bausch Health Companies, Inc. received FDA approval for Miebo, a dry eye treatment prescription drug.
  • In February 2023, Bayer AG submitted aflibercept 8 mg for regulatory approval in the EU for two major retinal diseases.
  • In January 2023, Bausch Health Companies, Inc. launched PreserVision AREDS 2 Formula minigel eye vitamins in the U.S. It was developed for people with moderate-to-advanced AMD.

Ophthalmic Drugs Market Top Key Companies:

The following are the leading companies in the ophthalmic drugs market. These companies collectively hold the largest market share and dictate industry trends. Financials, strategy maps & products of these ophthalmic drugs companies are analyzed to map the supply network.

  • Pfizer Inc.
  • Alcon
  • Novartis AG
  • Bausch Health Companies Inc.
  • Merck & Co., Inc
  • Regeneron Pharmaceuticals Inc
  • Allergan (AbbVie Inc)
  • Bayer AG
  • Genentech, Inc. (F. Hoffmann-La Roche Ltd)
  • Nicox
  • Coherus Biosciences, Inc.

Ophthalmic Drugs Market Report Segmentation

This report forecasts revenue growth at country levels and provides an analysis of the latest industry trends in each of the sub-segments from 2021 to 2033. For this study, Nova one advisor, Inc. has segmented the Ophthalmic Drugs market.

By Drug Class 

  • Anti-allergy
    • Anti-inflammatory
    • Non-steroidal drugs
  • Steroidal drugs
  • Anti-VEGF Agents
  • Anti-glaucoma
  • Others

By Disease 

  • Dry Eye
    • Gels
    • Eye Solutions & Suspensions
    • Capsules & Tablets
    • Eye Drops
    • Ointments
  • Allergies
    • Gels
    • Eye Solutions & Suspensions
    • Capsules & Tablets
    • Eye Drops
    • Ointments
  • Glaucoma
    • Gels
    • Eye Solutions & Suspensions
    • Capsules & Tablets
    • Eye Drops
    • Ointments
  • Eye Infection
    • Gels
    • Eye Solutions & Suspensions
    • Capsules & Tablets
    • Eye Drops
    • Ointments
  • Infection
    • Gels
    • Eye Solutions & Suspensions
    • Capsules & Tablets
    • Eye Drops
    • Ointments
  • Retinal Disorders
    • Retinal Disorder Treatment Market, By Type,
      • Macular Degeneration
      • Diabetic Retinopathy
    • Retinal Disorder Treatment Market, By Dosage Type,
      • Gels
      • Eye Solutions & Suspensions
      • Capsules & Tablets
      • Eye Drops
      • Ointments
  • Uveitis
    • Gels
    • Eye Solutions & Suspensions
    • Capsules & Tablets
    • Eye Drops
    • Ointments
  • Others

By Dosage Form 

  • Gels
  • Eye Solutions & Suspensions
  • Capsules and Tablets
  • Eye Drops
  • Ointments

By Route of Administration 

  • Topical
    • Retinal Disorders
    • Subconjunctival
    • Intravitreal
    • Retrobulbar
    • Intracameral
  • Local Ocular
  • Systemic

By Product Type 

  • Prescription Drugs
  • OTC

By Product 

  • Branded Drugs
  • Generic Drugs

By Region

  • North America
  • Europe
  • Asia-Pacific
  • Latin America
  • Middle East & Africa (MEA)

Frequently Asked Questions

Key factors that are driving the ophthalmic drugs market growth include the rising prevalence of eye diseases and disorders along with the presence of a robust pipeline of molecules.

The global ophthalmic drugs market size was valued at USD 41.65 billion in 2023 and is projected to surpass around USD 70.07 billion by 2033

The global ophthalmic drugs market is expected to grow at a compound annual growth rate of 5.34% from 2024 to 2033

Some of the major companies in the ophthalmic drugs market include Bausch & Lomb, Inc.; Novartis AG; Pfizer, Inc.; Regeneron Pharmaceuticals Inc., Merck & Co., Inc.; AbbVie Inc; Bayer AG; Johnson & Johnson Private Limited.; Santen Pharmaceutical Co., Ltd., and Genentech, Inc.

Chapter 1. Methodology and Scope
                    1.1. Market Segmentation & Scope
                    1.2. Segment Definitions
                        1.2.1. Drug Class
                        1.2.2. Disease
                        1.2.3. Route of Administration
                        1.2.4. Dosage Type
                        1.2.5. Product Type
                        1.2.6. Product
                        1.2.7. Regional scope
                        1.2.8. Estimates and forecasts timeline
                    1.3. Research Methodology
                    1.4. Information Procurement
                        1.4.1. Purchased database
                        1.4.2. Nova one advisor’s internal database
                        1.4.3. Secondary sources
                        1.4.4. Primary research
                        1.4.5. Details of primary research
                            1.4.5.1. Data for primary interviews in North America
                            1.4.5.2. Data for primary interviews in Europe
                            1.4.5.3. Data for primary interviews in Asia Pacific
                            1.4.5.4. Data for primary interviews in Latin America
                            1.4.5.5. Data for Primary interviews in MEA
                    1.5. Information or Data Analysis
                        1.5.1. Data analysis models
                    1.6. Market Formulation & Validation
                    1.7. Model Details
                        1.7.1. Commodity flow analysis (Model 1)
                        1.7.2. Approach 1: Commodity flow approach
                        1.7.3. Volume price analysis (Model 2)
                        1.7.4. Approach 2: Volume price analysis
                    1.8. List of Secondary Sources
                    1.9. List of Primary Sources
                    1.10. Objectives
Chapter 2. Executive Summary
                    2.1. Market Outlook
                    2.2. Segment Outlook
                        2.2.1. Drug class and disease outlook
                        2.2.2. Route of administration and dosage type outlook
                        2.2.3. Product type and product outlook
                        2.2.4. Regional outlook
                    2.3. Competitive Insights
Chapter 3. Ophthalmic Drugs Market Variables, Trends & Scope
                    3.1. Market Lineage Outlook
                        3.1.1. Parent market outlook
                        3.1.2. Related/ancillary market outlook
                    3.2. Market Dynamics
                        3.2.1. Market driver analysis
                            3.2.1.1. Increasing disease prevalence
                            3.2.1.2. Strong developmental pipeline
                            3.2.1.3. Advancement in drug delivery
                            3.2.1.4. Promising investment scenario
                        3.2.2. Market restraint analysis
                            3.2.2.1. Patent expiry of blockbuster drugs
                    3.3. Ophthalmic Drugs Market Analysis Tools
                        3.3.1. Industry Analysis – Porter’s
                            3.3.1.1. Supplier power
                            3.3.1.2. Buyer power
                            3.3.1.3. Substitution threat
                            3.3.1.4. Threat of new entrant
                            3.3.1.5. Competitive rivalry
                        3.3.2. PESTEL Analysis
                            3.3.2.1. Political landscape
                            3.3.2.2. Technological landscape
                            3.3.2.3. Economic landscape
                        3.3.3. Pricing Analysis
                        3.3.4. Pipeline Analysis
                        3.3.5. Patent Expiry Analysis
Chapter 4. Ophthalmic Drugs Market: Drug Class Estimates & Trend Analysis
                    4.1. Drug Class Market Share, 2024 to 2033
                    4.2. Segment Dashboard
                    4.3. Global Ophthalmic Drugs Market by Drug Class Outlook
                    4.4. Market Size & Forecasts and Trend Analyses, 2021 to 2033 for the following
                        4.4.1. Anti-allergy
                            4.4.1.1. Anti-allergy market estimates and forecasts 2021 to 2033
                        4.4.2. Anti-VEGF Agents
                            4.4.2.1. Anti-VEGF agents market estimates and forecasts 2021 to 2033
                        4.4.3. Anti-inflammatory
                            4.4.3.1. Anti-inflammatory market estimates and forecasts 2021 to 2033
                            4.4.3.2. Non-steroidal drugs
                                4.4.3.2.1. Non-steroidal drugs market estimates and forecasts 2021 to 2033
                            4.4.3.3. Steroids
                                4.4.3.3.1. Steroids market estimates and forecasts 2021 to 2033
                        4.4.4. Anti- glaucoma
                            4.4.4.1. Anti- glaucoma market estimates and forecasts 2021 to 2033
                        4.4.5. Gene and Cell Therapy
                            4.4.5.1. Gene and cell therapy market estimates and forecasts 2021 to 2033
                        4.4.6. Others
                            4.4.6.1. Others market estimates and forecasts 2021 to 2033
Chapter 5. Ophthalmic Drugs Market: Disease Estimates & Trend Analysis
                    5.1. Disease Market Share, 2024 to 2033
                    5.2. Segment Dashboard
                    5.3. Global Ophthalmic Drugs Market by Disease Outlook
                    5.4. Market Size & Forecasts and Trend Analyses, 2021 to 2033 for the following
                        5.4.1. Dry Eye
                            5.4.1.1. Dry eye market estimates and forecasts 2021 to 2033
                        5.4.2. Allergies
                            5.4.2.1. Allergies market estimates and forecasts 2021 to 2033
                        5.4.3. Glaucoma
                            5.4.3.1. Glaucoma market estimates and forecasts 2021 to 2033
                        5.4.4. Infection
                            5.4.4.1. Infection market estimates and forecasts 2021 to 2033
                        5.4.5. Retinal Disorders
                            5.4.5.1. Retinal disorders market estimates and forecasts 2021 to 2033
                            5.4.5.2. Macular Degeneration
                                5.4.5.2.1. Macular degeneration market estimates and forecasts 2021 to 2033
                            5.4.5.3. Diabetic Retinopathy
                                5.4.5.3.1. Diabetic retinopathy market estimates and forecasts 2021 to 2033
                            5.4.5.4. Others
                                5.4.5.4.1. Others market estimates and forecasts 2021 to 2033
                        5.4.6. Uveitis
                            5.4.6.1. Uveitis market estimates and forecasts 2021 to 2033
                        5.4.7. Others
                            5.4.7.1. Others market estimates and forecasts 2021 to 2033
Chapter 6. Ophthalmic Drugs Market: Route of Administration Estimates & Trend Analysis
                    6.1. Route of Administration Market Share, 2024 to 2033
                    6.2. Segment Dashboard
                    6.3. Global Ophthalmic Drugs Market by Route of Administration Outlook
                    6.4. Market Size & Forecasts and Trend Analyses, 2021 to 2033 for the following
                        6.4.1. Topical
                            6.4.1.1. Topical market estimates and forecasts 2021 to 2033
                        6.4.2. Local Ocular
                            6.4.2.1. Local ocular market estimates and forecasts 2021 to 2033
                            6.4.2.2. Subconjunctival
                                6.4.2.2.1. Subconjunctival market estimates and forecasts 2021 to 2033
                            6.4.2.3. Intravitreal
                                6.4.2.3.1. Intravitreal market estimates and forecasts 2021 to 2033
                            6.4.2.4. Retrobulbar
                                6.4.2.4.1. Others market estimates and forecasts 2021 to 2033
                            6.4.2.5. Intracameral
                                6.4.2.5.1. Intracameral market estimates and forecasts 2021 to 2033
                        6.4.3. Systemic
                            6.4.3.1. Systemic market estimates and forecasts 2021 to 2033
Chapter 7. Ophthalmic Drugs Market: Dosage Type Estimates & Trend Analysis
                    7.1. Dosage Type Market Share, 2024 to 2033
                    7.2. Segment Dashboard
                    7.3. Global Ophthalmic Drugs Market by Dosage Type Outlook
                    7.4. Market Size & Forecasts and Trend Analyses, 2021 to 2033 for the following
                        7.4.1. Gels
                            7.4.1.1. Gels market estimates and forecasts 2021 to 2033
                        7.4.2. Eye Solutions and Suspensions
                            7.4.2.1. Eye solutions and suspensions market estimates and forecasts 2021 to 2033
                        7.4.3. Capsules and Tablets
                            7.4.3.1. Capsules and tablets market estimates and forecasts 2021 to 2033
                        7.4.4. Eye Drops
                            7.4.4.1. Eye drops market estimates and forecasts 2021 to 2033
                        7.4.5. Ointments
                            7.4.5.1. Ointments market estimates and forecasts 2021 to 2033
Chapter 8. Ophthalmic Drugs Market: Product Type Estimates & Trend Analysis
                    8.1. Product Type Market Share, 2024 to 2033
                    8.2. Segment Dashboard
                    8.3. Global Ophthalmic Drugs Market by Product Type Outlook
                    8.4. Market Size & Forecasts and Trend Analyses, 2021 to 2033 for the following
                        8.4.1. OTC
                            8.4.1.1. OTC market estimates and forecasts 2021 to 2033
                        8.4.2. Prescription Drugs
                            8.4.2.1. Prescription drugs market estimates and forecasts 2021 to 2033
Chapter 9. Ophthalmic Drugs Market: Product Estimates & Trend Analysis
                    9.1. Product Market Share, 2024 to 2033
                    9.2. Segment Dashboard
                    9.3. Global Ophthalmic Drugs Market by Product Outlook
                    9.4. Market Size & Forecasts and Trend Analyses, 2021 to 2033 for the following
                        9.4.1. Branded Drugs
                            9.4.1.1. Branded drugs market estimates and forecasts 2021 to 2033
                        9.4.2. Generic Drugs
                            9.4.2.1. Generic drugs market estimates and forecasts 2021 to 2033
Chapter 10. Ophthalmic Drugs Market: Regional Estimates & Trend Analysis
                    10.1. Regional Market Share Analysis, 2024 to 2033
                    10.2. Regional Market Dashboard
                    10.3. Global Regional Market Snapshot
                    10.4. Market Size, & Forecasts Trend Analysis, 2021 to 2033:
                    10.5. North America
                        10.5.1. U.S.
                            10.5.1.1. Key country dynamics
                            10.5.1.2. Regulatory framework/ reimbursement structure
                            10.5.1.3. Competitive scenario
                            10.5.1.4. U.S. market estimates and forecasts 2021 to 2033
                        10.5.2. Canada
                            10.5.2.1. Key country dynamics
                            10.5.2.2. Regulatory framework/ reimbursement structure
                            10.5.2.3. Competitive scenario
                            10.5.2.4. Canada market estimates and forecasts 2021 to 2033
                    10.6. Europe
                        10.6.1. UK
                            10.6.1.1. Key country dynamics
                            10.6.1.2. Regulatory framework/ reimbursement structure
                            10.6.1.3. Competitive scenario
                            10.6.1.4. UK market estimates and forecasts 2021 to 2033
                        10.6.2. Germany
                            10.6.2.1. Key country dynamics
                            10.6.2.2. Regulatory framework/ reimbursement structure
                            10.6.2.3. Competitive scenario
                            10.6.2.4. Germany market estimates and forecasts 2021 to 2033
                        10.6.3. France
                            10.6.3.1. Key country dynamics
                            10.6.3.2. Regulatory framework/ reimbursement structure
                            10.6.3.3. Competitive scenario
                            10.6.3.4. France market estimates and forecasts 2021 to 2033
                        10.6.4. Italy
                            10.6.4.1. Key country dynamics
                            10.6.4.2. Regulatory framework/ reimbursement structure
                            10.6.4.3. Competitive scenario
                            10.6.4.4. Italy market estimates and forecasts 2021 to 2033
                        10.6.5. Spain
                            10.6.5.1. Key country dynamics
                            10.6.5.2. Regulatory framework/ reimbursement structure
                            10.6.5.3. Competitive scenario
                            10.6.5.4. Spain market estimates and forecasts 2021 to 2033
                        10.6.6. Norway
                            10.6.6.1. Key country dynamics
                            10.6.6.2. Regulatory framework/ reimbursement structure
                            10.6.6.3. Competitive scenario
                            10.6.6.4. Norway market estimates and forecasts 2021 to 2033
                        10.6.7. Sweden
                            10.6.7.1. Key country dynamics
                            10.6.7.2. Regulatory framework/ reimbursement structure
                            10.6.7.3. Competitive scenario
                            10.6.7.4. Sweden market estimates and forecasts 2021 to 2033
                        10.6.8. Denmark
                            10.6.8.1. Key country dynamics
                            10.6.8.2. Regulatory framework/ reimbursement structure
                            10.6.8.3. Competitive scenario
                            10.6.8.4. Denmark market estimates and forecasts 2021 to 2033
                    10.7. Asia Pacific
                        10.7.1. Japan
                            10.7.1.1. Key country dynamics
                            10.7.1.2. Regulatory framework/ reimbursement structure
                            10.7.1.3. Competitive scenario
                            10.7.1.4. Japan market estimates and forecasts 2021 to 2033
                        10.7.2. China
                            10.7.2.1. Key country dynamics
                            10.7.2.2. Regulatory framework/ reimbursement structure
                            10.7.2.3. Competitive scenario
                            10.7.2.4. China market estimates and forecasts 2021 to 2033
                        10.7.3. India
                            10.7.3.1. Key country dynamics
                            10.7.3.2. Regulatory framework/ reimbursement structure
                            10.7.3.3. Competitive scenario
                            10.7.3.4. India market estimates and forecasts 2021 to 2033
                        10.7.4. Australia
                            10.7.4.1. Key country dynamics
                            10.7.4.2. Regulatory framework/ reimbursement structure
                            10.7.4.3. Competitive scenario
                            10.7.4.4. Australia market estimates and forecasts 2021 to 2033
                        10.7.5. South Korea
                            10.7.5.1. Key country dynamics
                            10.7.5.2. Regulatory framework/ reimbursement structure
                            10.7.5.3. Competitive scenario
                            10.7.5.4. South Korea market estimates and forecasts 2021 to 2033
                        10.7.6. Thailand
                            10.7.6.1. Key country dynamics
                            10.7.6.2. Regulatory framework/ reimbursement structure
                            10.7.6.3. Competitive scenario
                            10.7.6.4. Thailand market estimates and forecasts 2021 to 2033
                    10.8. Latin America
                        10.8.1. Brazil
                            10.8.1.1. Key country dynamics
                            10.8.1.2. Regulatory framework/ reimbursement structure
                            10.8.1.3. Competitive scenario
                            10.8.1.4. Brazil market estimates and forecasts 2021 to 2033
                        10.8.2. Mexico
                            10.8.2.1. Key country dynamics
                            10.8.2.2. Regulatory framework/ reimbursement structure
                            10.8.2.3. Competitive scenario
                            10.8.2.4. Mexico market estimates and forecasts 2021 to 2033
                        10.8.3. Argentina
                            10.8.3.1. Key country dynamics
                            10.8.3.2. Regulatory framework/ reimbursement structure
                            10.8.3.3. Competitive scenario
                            10.8.3.4. Argentina market estimates and forecasts 2021 to 2033
                    10.9. MEA
                        10.9.1. South Africa
                            10.9.1.1. Key country dynamics
                            10.9.1.2. Regulatory framework/ reimbursement structure
                            10.9.1.3. Competitive scenario
                            10.9.1.4. South Africa market estimates and forecasts 2021 to 2033
                        10.9.2. Saudi Arabia
                            10.9.2.1. Key country dynamics
                            10.9.2.2. Regulatory framework/ reimbursement structure
                            10.9.2.3. Competitive scenario
                            10.9.2.4. Saudi Arabia market estimates and forecasts 2021 to 2033
                        10.9.3. UAE
                            10.9.3.1. Key country dynamics
                            10.9.3.2. Regulatory framework/ reimbursement structure
                            10.9.3.3. Competitive scenario
                            10.9.3.4. UAE market estimates and forecasts 2021 to 2033
                        10.9.4. Kuwait
                            10.9.4.1. Key country dynamics
                            10.9.4.2. Regulatory framework/ reimbursement structure
                            10.9.4.3. Competitive scenario
                            10.9.4.4. Kuwait market estimates and forecasts 2021 to 2033
Chapter 11. Competitive Landscape
                    11.1. Recent Developments & Impact Analysis, By Key Market Participants
                    11.2. Company/Competition Categorization
                    11.3. Vendor Landscape
                        11.3.1. List of key distributors and channel partners
                        11.3.2. Key customers
                        11.3.3. Key company market share analysis, 2023
                        11.3.4. Pfizer Inc.
                            11.3.4.1. Company overview
                            11.3.4.2. Financial performance
                            11.3.4.3. Product benchmarking
                            11.3.4.4. Strategic initiatives
                        11.3.5. Alcon
                            11.3.5.1. Company overview
                            11.3.5.2. Financial performance
                            11.3.5.3. Product benchmarking
                            11.3.5.4. Strategic initiatives
                        11.3.6. Novartis AG
                            11.3.6.1. Company overview
                            11.3.6.2. Financial performance
                            11.3.6.3. Product benchmarking
                            11.3.6.4. Strategic initiatives
                        11.3.7. Bausch Health Companies Inc.
                            11.3.7.1. Company overview
                            11.3.7.2. Financial performance
                            11.3.7.3. Product benchmarking
                            11.3.7.4. Strategic initiatives
                        11.3.8. Merck & Co., Inc.
                            11.3.8.1. Company overview
                            11.3.8.2. Financial performance
                            11.3.8.3. Product benchmarking
                            11.3.8.4. Strategic initiatives
                        11.3.9. Regeneron Pharmaceuticals Inc.
                            11.3.9.1. Company overview
                            11.3.9.2. Financial performance
                            11.3.9.3. Product benchmarking
                            11.3.9.4. Strategic initiatives
                        11.3.10. Allergan (AbbVie Inc)
                            11.3.10.1. Company overview
                            11.3.10.2. Financial performance
                            11.3.10.3. Product benchmarking
                            11.3.10.4. Strategic initiatives
                        11.3.11. Bayer AG
                            11.3.11.1. Company overview
                            11.3.11.2. Financial performance
                            11.3.11.3. Product benchmarking
                            11.3.11.4. Strategic initiatives
                        11.3.12. Genentech, Inc. (F. Hoffmann-La Roche Ltd)
                            11.3.12.1. Company overview
                            11.3.12.2. Financial performance
                            11.3.12.3. Product benchmarking
                            11.3.12.4. Strategic initiatives
                        11.3.13. Nicox
                            11.3.13.1. Company overview
                            11.3.13.2. Financial performance
                            11.3.13.3. Product benchmarking
                            11.3.13.4. Strategic initiatives
                        11.3.14. Coherus BioSciences
                            11.3.14.1. Company overview
                            11.3.14.2. Financial performance
                            11.3.14.3. Product benchmarking
                            11.3.14.4. Strategic initiatives

Proceed To Buy

USD 4500
USD 3900
USD 1900
USD 1200

Customization Offered

  • check-img Cross-segment Market Size and Analysis for Mentioned Segments
  • check-imgAdditional Company Profiles (Upto 5 With No Cost)
  • check-img Additional Countries (Apart From Mentioned Countries)
  • check-img Country/Region-specific Report
  • check-img Go To Market Strategy
  • check-imgRegion Specific Market Dynamics
  • check-imgRegion Level Market Share
  • check-img Import Export Analysis
  • check-imgProduction Analysis
  • check-imgOthers