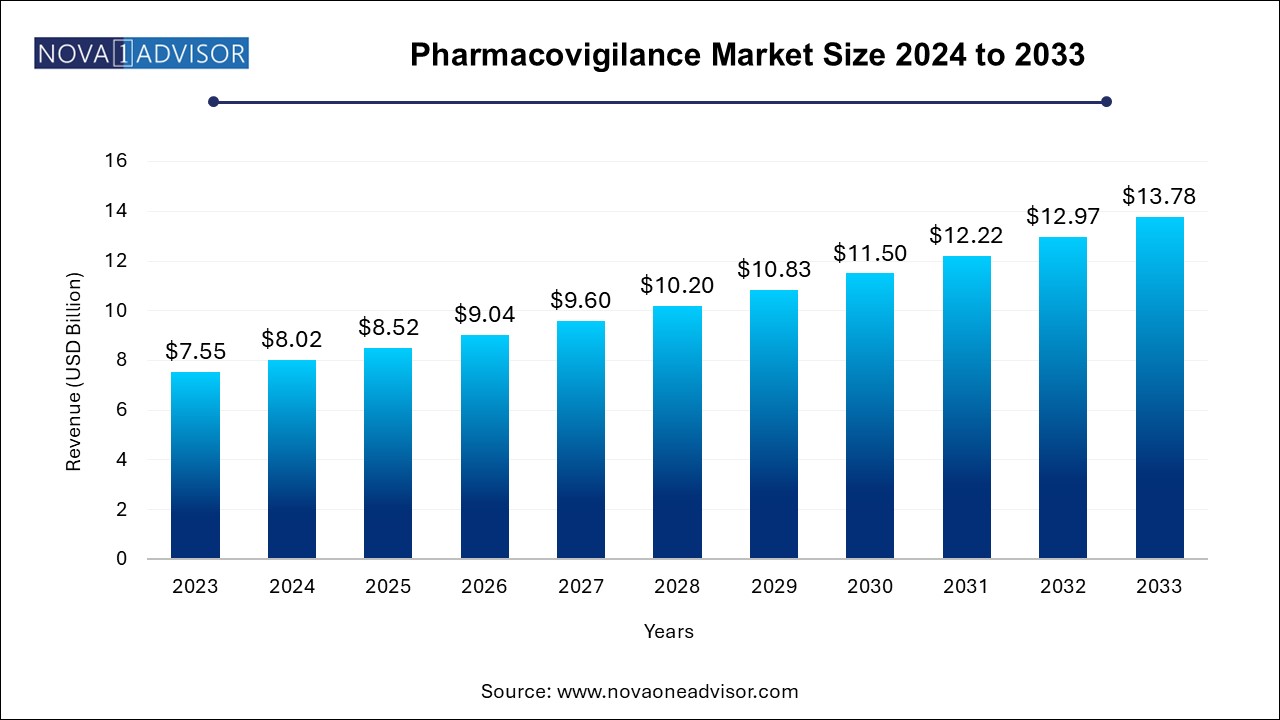
The pharmacovigilance market size was exhibited at USD 7.55 billion in 2024 and is projected to hit around USD 13.78 billion by 2033, growing at a CAGR of 6.2% during the forecast period 2024 to 2033.

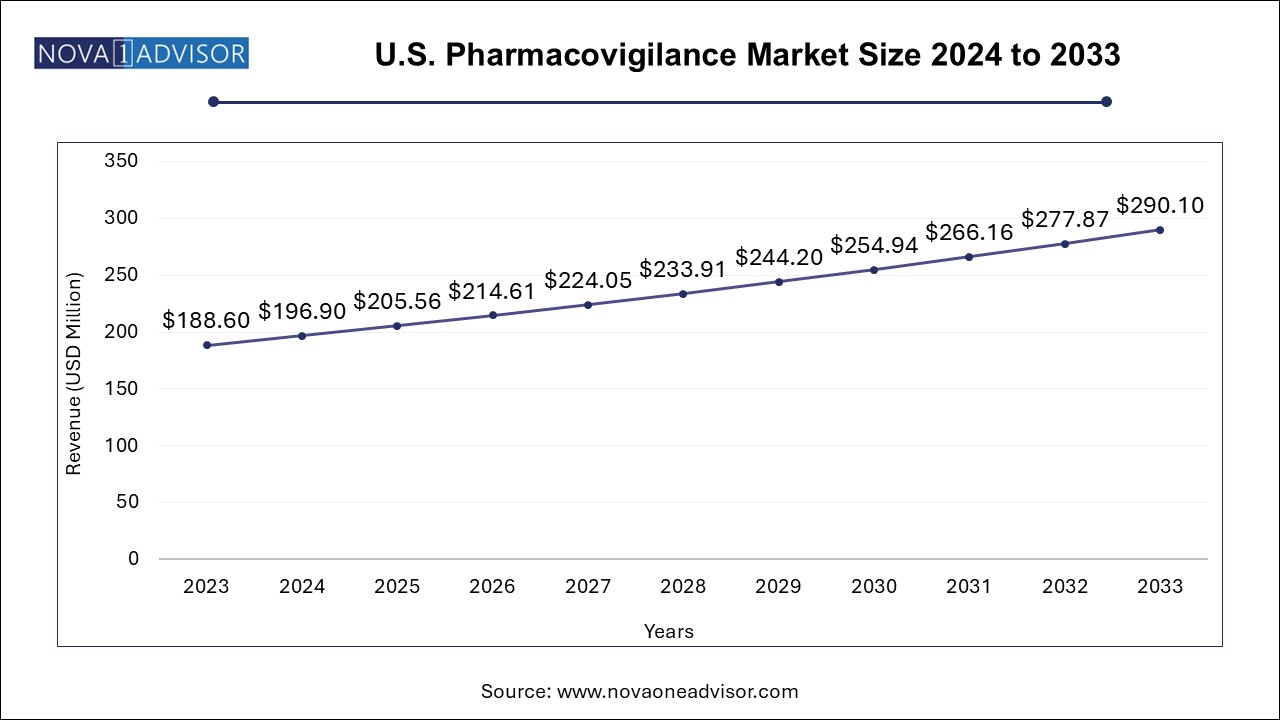
The U.S. pharmacovigilance market size was exhibited at USD 188.60 million in 2024 and is projected to hit around USD 290.10 million by 2033, growing at a CAGR of 4.4% during the forecast period 2024 to 2033.

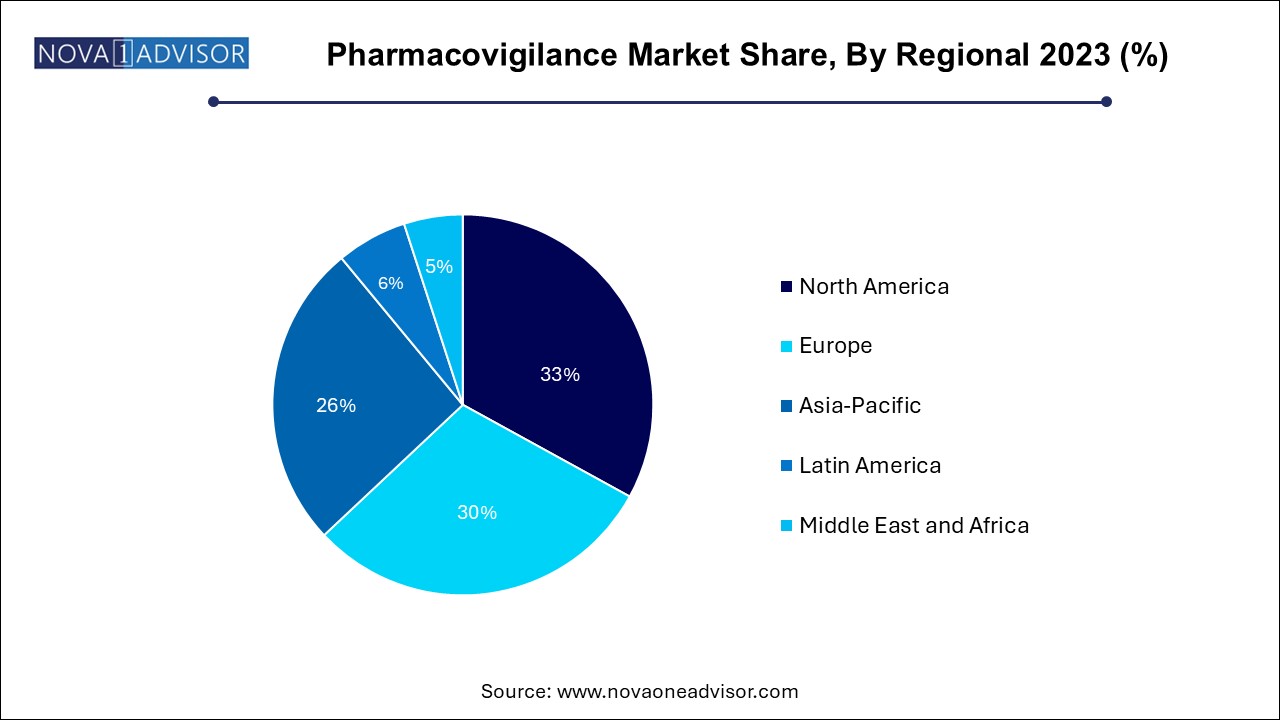
North America, led by the United States, holds the largest share of the pharmacovigilance market, owing to a mature regulatory environment, high drug development activity, and robust digital infrastructure. The U.S. FDA has established comprehensive pharmacovigilance frameworks, including FAERS and REMS, driving extensive compliance among pharmaceutical companies. Major players like Pfizer, Merck, and Johnson & Johnson operate sophisticated safety departments that collaborate with third-party vendors for global PV operations. The region also hosts numerous pharmacovigilance conferences and academic programs, contributing to talent development and best practices.

Asia Pacific is the Fastest-Growing Region
Asia Pacific is rapidly emerging as the fastest-growing region, driven by increasing drug trials, favorable outsourcing policies, and rising investments in life sciences. Countries like India, China, and the Philippines are becoming global pharmacovigilance hubs due to a skilled workforce, English proficiency, and cost advantages. Regulatory bodies such as India's CDSCO and China’s NMPA are strengthening safety monitoring infrastructure, improving pharmacovigilance maturity. Additionally, domestic pharmaceutical companies are adopting global standards, expanding demand for end-to-end pharmacovigilance services.
The global pharmacovigilance market has gained significant prominence in recent years as regulatory bodies, healthcare providers, and pharmaceutical companies emphasize patient safety and drug efficacy. Pharmacovigilance, defined as the science and activities related to the detection, assessment, understanding, and prevention of adverse effects or any other drug-related problems, has become an integral part of the drug development and post-marketing process.
The evolution of the market is driven by the increasing complexity of therapeutic modalities, a growing number of drug approvals, and the need for rigorous monitoring of adverse drug reactions (ADRs). As drug pipelines expand and treatments become more personalized, ensuring comprehensive safety surveillance across the product life cycle—from pre-clinical trials to post-marketing surveillance—is critical. Furthermore, the emergence of digital health ecosystems, electronic health records (EHRs), and artificial intelligence has transformed pharmacovigilance into a more predictive and proactive discipline.
Pharmaceutical and biotechnology companies are under pressure to comply with stringent safety regulations imposed by entities like the U.S. FDA, EMA, and ICH. These agencies have set high expectations for signal detection, case management, and risk evaluation systems. As a result, there is a notable shift toward outsourcing pharmacovigilance services to specialized contract research organizations (CROs) and service providers, particularly in cost-sensitive or resource-limited settings.
Additionally, the COVID-19 pandemic exposed the need for agile pharmacovigilance frameworks, as vaccines and therapeutics were developed and approved at record speed. This unprecedented pace emphasized the importance of real-time safety monitoring and post-marketing vigilance—laying the groundwork for a market transformation that is expected to continue throughout the next decade.
Integration of AI and Machine Learning in Signal Detection
Companies are increasingly deploying AI algorithms for faster and more accurate identification of potential safety signals from vast data sources.
Outsourcing of Pharmacovigilance Services
Cost pressures and the need for specialized expertise are driving a global outsourcing trend, especially to markets in Asia Pacific and Eastern Europe.
Adoption of Electronic Health Records (EHR) and Real-world Data (RWD)
Real-world evidence from EHRs and patient registries is being used to complement clinical trial data in post-marketing safety assessments.
Expansion of Pharmacovigilance Beyond Pharmaceuticals
Medical device manufacturers and biologics developers are investing in dedicated pharmacovigilance teams and infrastructure.
Harmonization of Global Regulatory Standards
Initiatives by international regulatory bodies are promoting standardized pharmacovigilance reporting across multiple geographies.
Rise of Patient-centered and Mobile-enabled Reporting Tools
Mobile apps and patient portals are empowering consumers to report adverse drug reactions directly, increasing data quality and volume.
Proliferation of Risk Management Systems
Companies are adopting integrated risk evaluation and mitigation strategies (REMS) to monitor and address risks proactively.
| Report Coverage | Details |
| Market Size in 2024 | USD 8.02 Billion |
| Market Size by 2033 | USD 13.78 Billion |
| Growth Rate From 2024 to 2033 | CAGR of 6.2% |
| Base Year | 2023 |
| Forecast Period | 2024-2033 |
| Segments Covered | Service Provider, Product Life Cycle, Type, Process Flow, Therapeutic Area, End use, Region |
| Market Analysis (Terms Used) | Value (US$ Million/Billion) or (Volume/Units) |
| Regional scope | North America, Europe, Asia Pacific, Latin America, MEA |
| Key Companies Profiled | Accenture; IQVIA; Cognizant; Clinquest Group B.V. (Linical Americas); IBM; Laboratory Corporation of America Holdings; ArisGlobal; Capgemini; ITClinical; ICON plc.; TAKE Solutions Ltd.; PAREXEL International Corporation.; Wipro; United BioSource LLC; BioClinica Inc (Clario).; ClinChoice (formerly FMD K&L) |
A pivotal driver fueling the growth of the pharmacovigilance market is the surge in drug approvals and the corresponding expansion of therapeutic categories. In 2023 alone, the U.S. FDA approved over 50 novel therapeutics, ranging from small molecules to gene therapies. These innovations, while promising, bring uncertainties related to long-term safety profiles, making robust pharmacovigilance critical.
With accelerated approval pathways like the FDA’s Fast Track and EMA’s PRIME schemes, many drugs are entering the market with limited long-term data. This scenario heightens the importance of phase IV (post-marketing) surveillance. For instance, the approval of oncology biosimilars and immunotherapies has necessitated more sophisticated signal detection and adverse event reporting systems. As treatment complexity rises—particularly in immunology, neurology, and rare diseases—the demand for real-time pharmacovigilance solutions is expected to soar.
Despite its essential role, pharmacovigilance operations involve significant costs and infrastructure investments. Maintaining an in-house pharmacovigilance team requires skilled personnel, sophisticated software platforms, and constant regulatory updates. For mid-sized and emerging pharma companies, these costs can be overwhelming, leading to uneven implementation of pharmacovigilance practices.
Moreover, pharmacovigilance processes—particularly case data management and signal detection—are labor-intensive and time-consuming. Processing adverse event reports, complying with global safety reporting timelines, and responding to regulatory audits require stringent operational discipline. In countries with limited digital infrastructure or workforce shortages, meeting compliance standards can hinder new market entry or delay clinical development.
The increasing digitization of health records and the availability of vast datasets present an immense opportunity for predictive pharmacovigilance. By leveraging EHR mining, real-world data, and patient registries, pharmaceutical companies can detect safety signals earlier and with greater accuracy. This approach not only enhances drug safety but also supports more informed regulatory and clinical decisions.
For instance, EHR mining tools can help identify off-label drug use patterns, correlations between comorbidities and ADRs, and long-term adverse effects that may not surface during clinical trials. Companies such as Oracle Health and ArisGlobal are investing in pharmacovigilance platforms that integrate AI-based analytics and machine learning for automated case classification and signal prioritization. This convergence of technology and pharmacovigilance is expected to become a core differentiator in the years ahead.
Phase IV (post-marketing) segment dominated the overall pharmacovigilance market in the product life cycle segment with over 75.9% revenue share in 2023. Drugs on the market are exposed to broader populations, diverse demographics, and longer usage periods—making them susceptible to unforeseen side effects. Pharmaceutical companies are required to establish active safety monitoring systems, submit periodic safety update reports (PSURs), and respond to safety alerts issued by health authorities.
Phase III is the fastest-growing segment, driven by the expansion of late-stage clinical trials across global sites. As regulatory agencies push for comprehensive safety data before approval, phase III trials now include more robust pharmacovigilance components. These include real-time AE monitoring platforms, centralized safety data review boards, and patient engagement technologies to ensure accurate ADR reporting. With the globalization of clinical trials, especially in oncology and rare diseases, the scope of pharmacovigilance in phase III continues to grow.
The contract outsourcing segment held the largest market share of 60.4% in 2023. largely due to the scalability, expertise, and cost advantages offered by CROs and pharmacovigilance service providers. Major pharmaceutical firms are increasingly forming long-term strategic alliances with vendors like IQVIA, ICON, and PAREXEL to manage case processing, regulatory submissions, and signal detection on a global scale. Outsourcing also enables smaller companies to comply with regulatory mandates without building expensive internal infrastructure.
In-house services are growing steadily, particularly among top-tier pharma companies that prioritize direct control and integration with clinical and regulatory teams. Companies with complex drug pipelines or unique safety requirements often prefer to maintain in-house pharmacovigilance systems to streamline operations, ensure faster feedback loops, and safeguard proprietary data. Internal pharmacovigilance teams are also integral to developing company-specific risk management strategies.
The spontaneous reporting segment dominated the market in 2023 with a share of 30.2%, Reflecting its widespread use as the standard method for collecting adverse event data from healthcare professionals, patients, and regulatory bodies. It plays a central role in signal detection and post-marketing surveillance, particularly for rare or severe ADRs. National databases like EudraVigilance (EU), FAERS (U.S.), and VigiBase (WHO) primarily rely on this reporting mechanism.
EHR mining is the fastest-growing type, fueled by advances in data integration and analytics. With vast amounts of patient data stored in digital systems, companies are tapping into these repositories to conduct real-world safety assessments. EHR mining enables pattern recognition and signal validation that would be difficult to detect via spontaneous reports alone. As interoperability and AI improve, this type is expected to revolutionize pharmacovigilance practices globally.
The oncology segment dominated the pharmacovigilance market, with a share of 26.9% in 2023. As cancer drugs—particularly immunotherapies and targeted therapies—often present complex, unpredictable side effects. These drugs may have narrow therapeutic windows and affect immune function, necessitating close pharmacovigilance monitoring. With many oncology drugs approved via accelerated pathways, phase IV surveillance is especially critical to manage long-term risks.
Neurology is the fastest-growing area, reflecting a surge in drug development for conditions like Alzheimer’s, Parkinson’s, and epilepsy. Many neurological drugs act on the central nervous system and may have subtle or delayed ADRs. Additionally, real-world data is increasingly used to study long-term neuropsychiatric outcomes. This has created a demand for specialized pharmacovigilance teams capable of assessing cognitive and behavioral AEs.
The signal detection segment held the largest revenue share in 2023. As regulatory bodies demand earlier identification and mitigation of risks. Advanced software solutions and data mining techniques are being used to identify emerging patterns from multiple data sources. Integration of adverse event logging and automated scoring systems for signal prioritization is enabling faster response times and proactive interventions.
The case data management segment is anticipated to grow at a lucrative CAGR in the coming years. Accounting for the highest volume of pharmacovigilance activities. This includes case intake, validation, medical coding, narrative writing, and submission to regulatory agencies. Given the volume of adverse event reports, especially for blockbuster drugs and vaccines, automation and global case processing hubs have become standard practice.
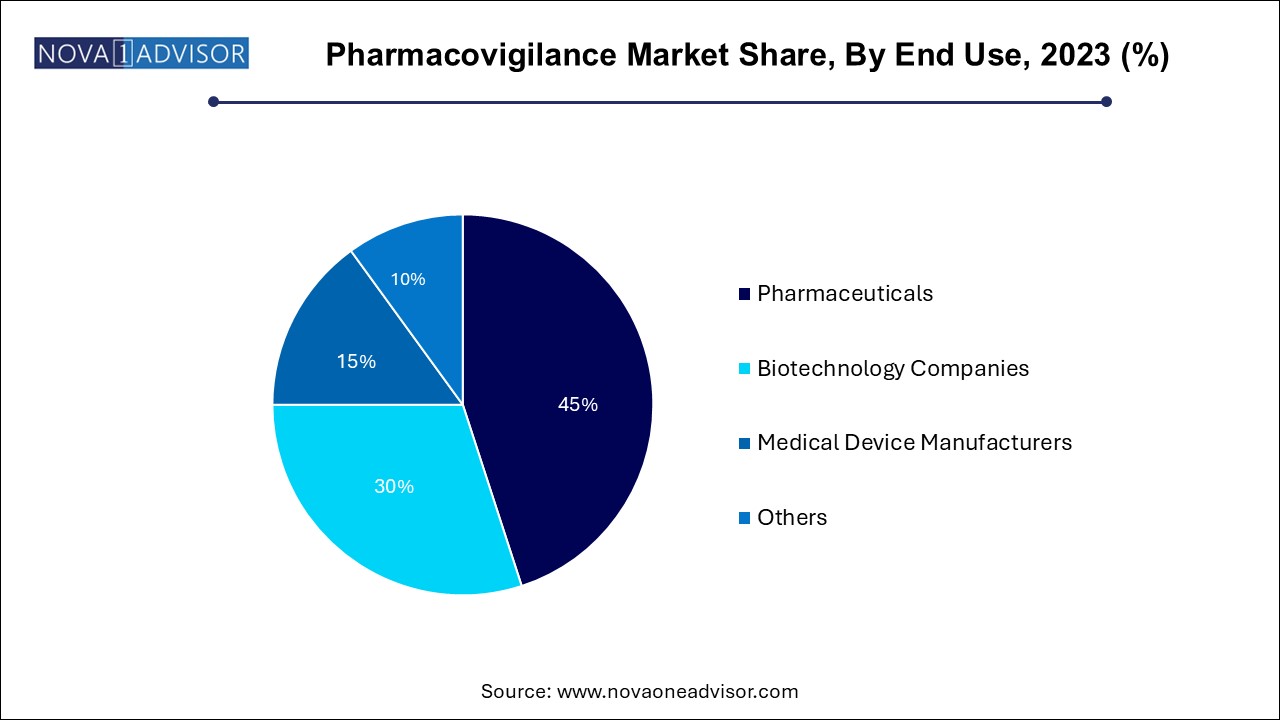
The pharmaceuticals segment dominated the market with a revenue share of over 44.0% in 2023. As they are the primary stakeholders responsible for ensuring drug safety from development through market maturity. Regulatory compliance, liability risk, and brand reputation drive significant investments in pharmacovigilance infrastructure. Multinational pharma firms typically manage global safety databases, operate signal review committees, and invest in automation tools to manage high case volumes.

Medical device manufacturers are the fastest-growing end users, as regulatory authorities now mandate rigorous post-market surveillance for devices. With new classifications under MDR (Medical Device Regulation) in the EU and similar reforms in other regions, companies must report device-related adverse events, conduct periodic safety updates, and implement vigilance plans. The rising complexity of combination products and digital therapeutics is also expanding the pharmacovigilance remit in this sector.
ArisGlobal, in February 2024, launched its LifeSphere® Multivigilance platform with enhanced AI capabilities for end-to-end pharmacovigilance case processing and signal management.
Oracle Health Sciences updated its Argus Safety suite in January 2024 with improved integration features for EHR systems and support for EU-specific regulatory formats.
IQVIA announced a partnership with a leading Asian CRO in November 2023 to expand its pharmacovigilance operations in the Asia Pacific region, leveraging local expertise for global compliance.
Parexel launched a new real-world data analytics division focused on oncology pharmacovigilance in October 2023, aiming to accelerate signal validation using EHR mining tools.
PharmaLex, in December 2023, expanded its pharmacovigilance services across Europe with a new center of excellence in Germany to support clients with end-to-end safety operations.
This report forecasts revenue growth at country levels and provides an analysis of the latest industry trends in each of the sub-segments from 2021 to 2033. For this study, Nova one advisor, Inc. has segmented the pharmacovigilance market
Product Life Cycle
Service Provider
Type
End Use
Therapeutic Area
Process Flow
Regional