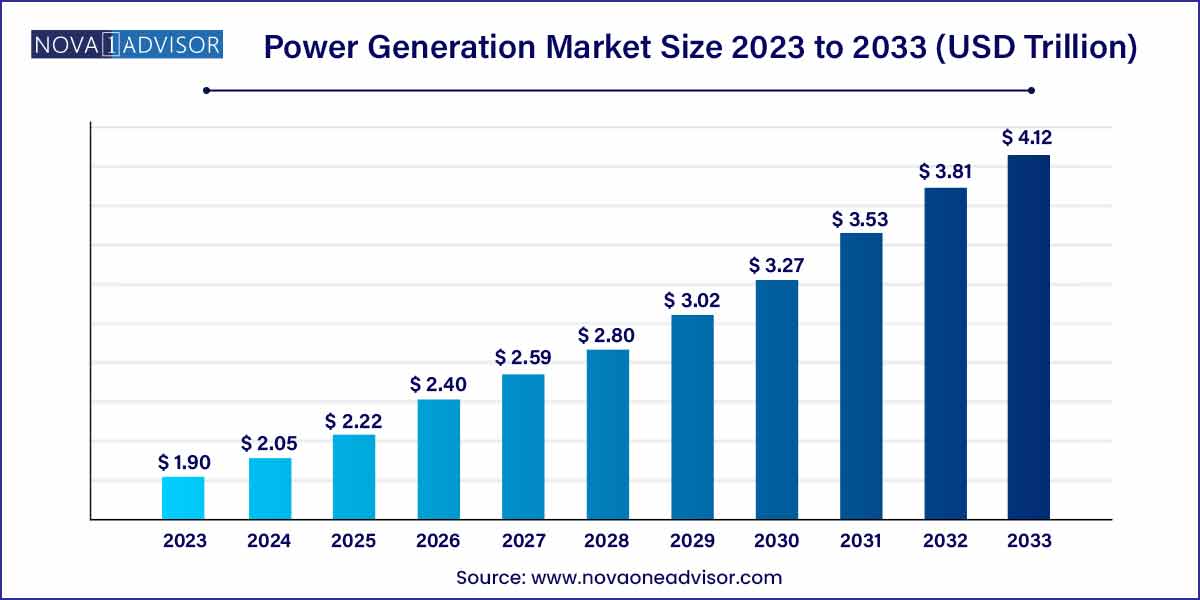
The global power generation market size was exhibited at USD 1.90 trillion in 2023 and is projected to hit around USD 4.12 trillion by 2033, growing at a CAGR of 8.05% during the forecast period of 2024 to 2033.
Key Takeaways:
As electricity is one of the essential commodities of modern economies and is responsible for providing a rising share of energy services. The demand of electricity is expected to increase as a consequence of increased household incomes, with the increased rate of electrification of transport and heat, and surging demand for digitally connected devices and air conditioners
Growth Factors
The power generation market has experienced a great demand due to various factors like increasing population with eventually increasing the number of consumers with rapid urbanization. The growing demand of electricity is expected to increase in the future due to the rising share of energy services. The economic growth of a nation is possible through the growth of its infrastructure in terms of power.
It leads to the overall welfare of a country. Developing the existing power infrastructure and creating new power infrastructure is extremely important for the growth of an economy
Sustainable ways are gaining popularity to introduce affordable power in many nations across the globe especially in the developing nations. Constant efforts are being made by the government in the recent times to reduce power shortage and create a surplus by installing more grids and increasing the network of distribution. The number of investments made for power generation in the developed as well as the developing nations of the world has grown in the recent times and this is expected to play a significant role in the growth of the market.
Power Generation Market Report Scop
Report Coverage | Details |
Market Size in 2024 | USD 1.90 Trillion |
Market Size by 2033 | USD 4.12 Trillion |
Growth Rate From 2024 to 2033 | CAGR of 8.05% |
Base Year | 2023 |
Forecast Period | 2024-2033 |
Segments Covered | By Type, By Phases and By Distribution Channel |
Market Analysis (Terms Used) | Value (US$ Million/Billion) or (Volume/Units) |
Regional Scope | North America; Europe; Asia Pacific; Central and South America; the Middle East and Africa |
Key Companies Profiled | Enel SpA, Electricite De France SA, State Power Investment Corporation, E.ON SE, Engie, Huaneng Power International, Inc., Exelon Corp, Endesa SA, Datang International Power Generation Company Limited, Inter RAO UES, Power Grid Corporation of India Limited, NTPC Limited, Tata Power, Adani Power, NHPC Limited, Guodian Corporation, Hokkaido Electric Power Company, Tohoku Electric Power Co, AGL Energy, EDF Energy, RWE, Scottish Power and Others. |
Key Market Drivers
Increase in population: The rapid increase in the population is serving as the key market driver for the power generation market. In the previous year, significant economic growth has been registered in many developing nations across the globe. The increasing population is one of the factors driving the growth of the global power generation market. Attractive growth opportunities and good potential will be provided by the nations like Mexico, Russia, Argentina, South Africa, South Korea, Indonesia, Thailand, Taiwan, China, Brazil, and India. The government policy is in these regions is supporting the growth of the global power generation market. Other favorable factors are the presence of renewable sources of energy production in most of these nations which have led to an increased amount of power generation through a sustainable source. The offered opportunities by the developing countries have given chance to future market players of the power generation market.
Rise in urbanization: The rise in urbanization in developing countries have given the speedy increase in demand for electricity, which has eventually forced the respective governments across the world to revamp various initiatives to ensure adequate power supply on their country.
Popularization of smart grid technologies: Smart grid technologies have gained popularity in the whole world due to the significant benefits in account to it efficiency and reliability. The surge in demand of smart grid has been expected as the major aspect that will affect the growth of the global power generation market in the upcoming years.
Key Market Challenges
Key Market Opportunities
Segments Insights:
Type Insights
The fossil fuel segment has dominated the power generation market in recent times with the maximum share in terms of the revenue generated through this type of power generation. On average, about 57% of the total share is held by the fossil fuel segment. The fastest compound annual growth rate will be registered by the solar segment in the anticipated time frame as this type of segment is gaining popularity due to several benefits offered by this type and the easy availability of solar energy will have a positive impact on the growth of this segment.
End-User Insights
The power generation market is segmented by end-user into Industrial, Commercial, Residential, and Transportation. As compared to all the other end users of electricity largest share is held by the residential segment in the power generation market and this accounts for 36% of the entire share in the market.
The fastest growth will be registered by the transport segment as the use of electricity in this segment has grown tremendously in recent times due to an increased need for transportation for various reasons. Industrial use of electricity in various sectors like the healthcare sector, chemical industries, food, and beverages industry, and manufacturing industries have shown significant growth and this is expected to be the case during the forecast period.
Source Insights
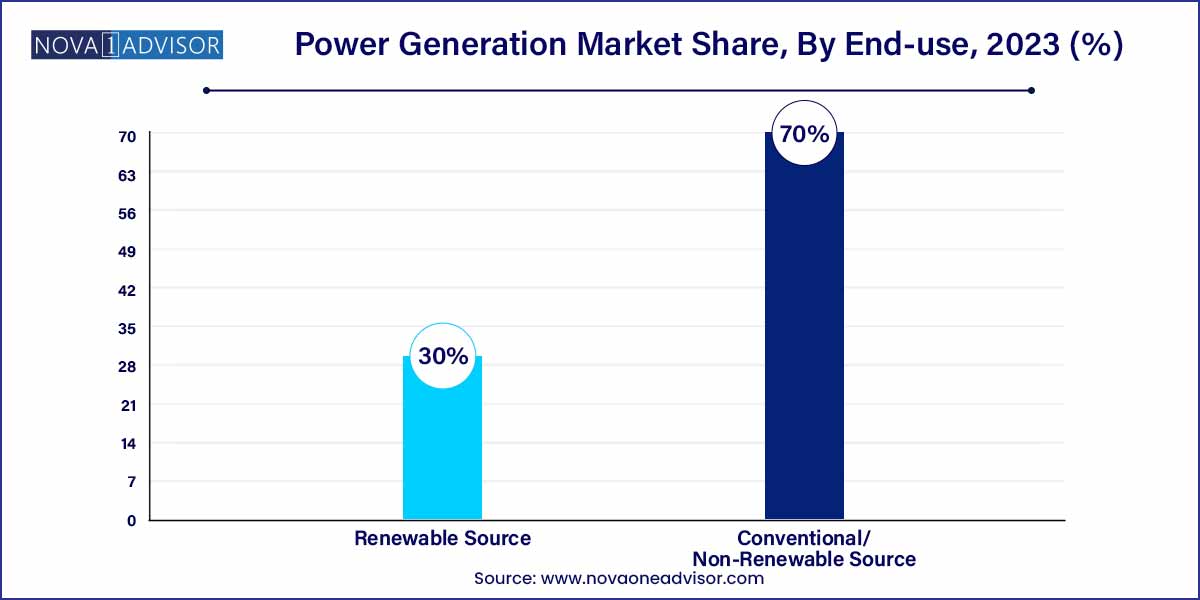
Based on the source, the non-renewable source segment holds a dominant position as compared to the other source and this accounts for 70% of the total share of the global power generation market. The highest compound annual growth rate will be registered by the renewable source of the power generation market.
Renewable sources provide constant energy and the use of advanced technologies like storage and carbon capture are expected to play a significant role in the growth of this market.
Grid Insights
Based on the type of grid used the on-grid segment has occupied the maximum market share of about 98% and it shall continue to grow during the forecast period. In the coming years there shall be an increase in the popularity of the off-grid segment and several favorable factors will influence the growth of this segment in the long run leading to a higher compound annual growth rate in the years to come.
Regional Insights
In the past maximum share was held by the Asia Pacific region as the amount of power generated in this region was maximum. The growth of this market has been increasing in European and North American nations. Africa and Middle East regions will show significant growth in the years to come. The government support received by the countries in the Asia Pacific region will lead to major improvements in various projects undertaken by the government. The growing demand for power generation will have a significant impact on developing the infrastructure required for new projects.
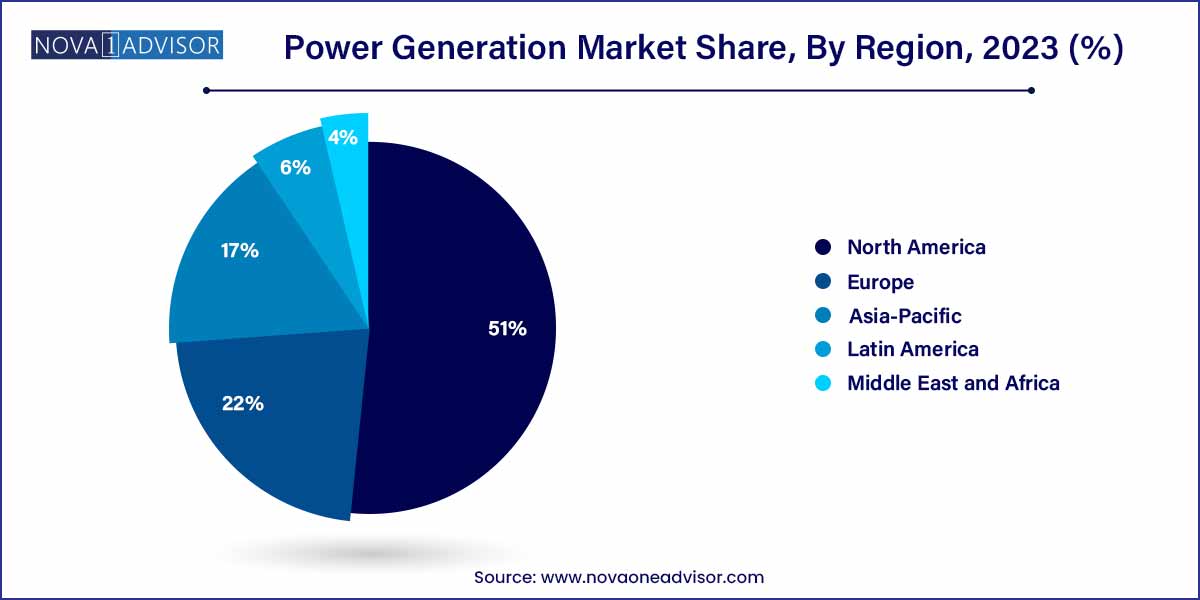
Renewable energy sources are being utilized in a sound manner and this is expected to play a significant role in the growth of the power generation market of the Asia Pacific region during the forecast period. The use of solar energy and wind energy for power generation in the Asia Pacific region is largely because a major part of its area comes under the equator. Such favorable conditions will have a significant impact on the growth of this market in the Asia Pacific region. Technological advancements in the North American region will lead to employing efficient power generation activities for the increasing demand.
Recent Developments
Some of the prominent players in the power generation market include:
Segments Covered in the Report
This report forecasts revenue growth at global, regional, and country levels and provides an analysis of the latest industry trends in each of the sub-segments from 2021 to 2033. For this study, Nova one advisor, Inc. has segmented the global power generation market.
By Type
By End-User
By Source
By Grid
By Region
Chapter 1. Introduction
1.1. Research Objective
1.2. Scope of the Study
1.3. Definition
Chapter 2. Research Methodology
2.1. Research Approach
2.2. Data Sources
2.3. Assumptions & Limitations
Chapter 3. Executive Summary
3.1. Market Snapshot
Chapter 4. Market Variables and Scope
4.1. Introduction
4.2. Market Classification and Scope
4.3. Industry Value Chain Analysis
4.3.1. Raw Material Procurement Analysis
4.3.2. Sales and Distribution Channel Analysis
4.3.3. Downstream Buyer Analysis
Chapter 5. COVID 19 Impact on Power Generation Market
5.1. COVID-19 Landscape: Power Generation Industry Impact
5.2. COVID 19 - Impact Assessment for the Industry
5.3. COVID 19 Impact: Global Major Government Policy
5.4. Market Trends and Opportunities in the COVID-19 Landscape
Chapter 6. Market Dynamics Analysis and Trends
6.1. Market Dynamics
6.1.1. Market Drivers
6.1.2. Market Restraints
6.1.3. Market Opportunities
6.2. Porter’s Five Forces Analysis
6.2.1. Bargaining power of suppliers
6.2.2. Bargaining power of buyers
6.2.3. Threat of substitute
6.2.4. Threat of new entrants
6.2.5. Degree of competition
Chapter 7. Competitive Landscape
7.1.1. Company Market Share/Positioning Analysis
7.1.2. Key Strategies Adopted by Players
7.1.3. Vendor Landscape
7.1.3.1. List of Suppliers
7.1.3.2. List of Buyers
Chapter 8. Global Power Generation Market, By Type
8.1. Power Generation Market, by Type, 2024-2033
8.1.1. Hydroelectricity
8.1.1.1. Market Revenue and Forecast (2021-2033)
8.1.2. Fossil Fuel Electricity
8.1.2.1. Market Revenue and Forecast (2021-2033)
8.1.3. Nuclear Electricity
8.1.3.1. Market Revenue and Forecast (2021-2033)
8.1.4. Solar Electricity
8.1.4.1. Market Revenue and Forecast (2021-2033)
8.1.5. Wind Electricity
8.1.5.1. Market Revenue and Forecast (2021-2033)
8.1.6. Geothermal Electricity
8.1.6.1. Market Revenue and Forecast (2021-2033)
8.1.7. Biomass Electricity
8.1.7.1. Market Revenue and Forecast (2021-2033)
8.1.8. Other Electricity
8.1.8.1. Market Revenue and Forecast (2021-2033)
Chapter 9. Global Power Generation Market, By End-User
9.1. Power Generation Market, by End-User, 2024-2033
9.1.1. Industrial
9.1.1.1. Market Revenue and Forecast (2021-2033)
9.1.2. Commercial
9.1.2.1. Market Revenue and Forecast (2021-2033)
9.1.3. Residential
9.1.3.1. Market Revenue and Forecast (2021-2033)
9.1.4. Transportation
9.1.4.1. Market Revenue and Forecast (2021-2033)
Chapter 10. Global Power Generation Market, By Source
10.1. Power Generation Market, by Source, 2024-2033
10.1.1. Conventional/Non-Renewable Source
10.1.1.1. Market Revenue and Forecast (2021-2033)
10.1.2. Renewable Source
10.1.2.1. Market Revenue and Forecast (2021-2033)
Chapter 11. Global Power Generation Market, By Grid
11.1. Power Generation Market, by Grid, 2024-2033
11.1.1. Off Grid
11.1.1.1. Market Revenue and Forecast (2021-2033)
11.1.2. On Grid
11.1.2.1. Market Revenue and Forecast (2021-2033)
Chapter 12. Global Power Generation Market, Regional Estimates and Trend Forecast
12.1. North America
12.1.1. Market Revenue and Forecast, by Type (2021-2033)
12.1.2. Market Revenue and Forecast, by End-User (2021-2033)
12.1.3. Market Revenue and Forecast, by Source (2021-2033)
12.1.4. Market Revenue and Forecast, by Grid (2021-2033)
12.1.5. U.S.
12.1.5.1. Market Revenue and Forecast, by Type (2021-2033)
12.1.5.2. Market Revenue and Forecast, by End-User (2021-2033)
12.1.5.3. Market Revenue and Forecast, by Source (2021-2033)
12.1.5.4. Market Revenue and Forecast, by Grid (2021-2033)
12.1.6. Rest of North America
12.1.6.1. Market Revenue and Forecast, by Type (2021-2033)
12.1.6.2. Market Revenue and Forecast, by End-User (2021-2033)
12.1.6.3. Market Revenue and Forecast, by Source (2021-2033)
12.1.6.4. Market Revenue and Forecast, by Grid (2021-2033)
12.2. Europe
12.2.1. Market Revenue and Forecast, by Type (2021-2033)
12.2.2. Market Revenue and Forecast, by End-User (2021-2033)
12.2.3. Market Revenue and Forecast, by Source (2021-2033)
12.2.4. Market Revenue and Forecast, by Grid (2021-2033)
12.2.5. UK
12.2.5.1. Market Revenue and Forecast, by Type (2021-2033)
12.2.5.2. Market Revenue and Forecast, by End-User (2021-2033)
12.2.5.3. Market Revenue and Forecast, by Source (2021-2033)
12.2.5.4. Market Revenue and Forecast, by Grid (2021-2033)
12.2.6. Germany
12.2.6.1. Market Revenue and Forecast, by Type (2021-2033)
12.2.6.2. Market Revenue and Forecast, by End-User (2021-2033)
12.2.6.3. Market Revenue and Forecast, by Source (2021-2033)
12.2.6.4. Market Revenue and Forecast, by Grid (2021-2033)
12.2.7. France
12.2.7.1. Market Revenue and Forecast, by Type (2021-2033)
12.2.7.2. Market Revenue and Forecast, by End-User (2021-2033)
12.2.7.3. Market Revenue and Forecast, by Source (2021-2033)
12.2.7.4. Market Revenue and Forecast, by Grid (2021-2033)
12.2.8. Rest of Europe
12.2.8.1. Market Revenue and Forecast, by Type (2021-2033)
12.2.8.2. Market Revenue and Forecast, by End-User (2021-2033)
12.2.8.3. Market Revenue and Forecast, by Source (2021-2033)
12.2.8.4. Market Revenue and Forecast, by Grid (2021-2033)
12.3. APAC
12.3.1. Market Revenue and Forecast, by Type (2021-2033)
12.3.2. Market Revenue and Forecast, by End-User (2021-2033)
12.3.3. Market Revenue and Forecast, by Source (2021-2033)
12.3.4. Market Revenue and Forecast, by Grid (2021-2033)
12.3.5. India
12.3.5.1. Market Revenue and Forecast, by Type (2021-2033)
12.3.5.2. Market Revenue and Forecast, by End-User (2021-2033)
12.3.5.3. Market Revenue and Forecast, by Source (2021-2033)
12.3.5.4. Market Revenue and Forecast, by Grid (2021-2033)
12.3.6. China
12.3.6.1. Market Revenue and Forecast, by Type (2021-2033)
12.3.6.2. Market Revenue and Forecast, by End-User (2021-2033)
12.3.6.3. Market Revenue and Forecast, by Source (2021-2033)
12.3.6.4. Market Revenue and Forecast, by Grid (2021-2033)
12.3.7. Japan
12.3.7.1. Market Revenue and Forecast, by Type (2021-2033)
12.3.7.2. Market Revenue and Forecast, by End-User (2021-2033)
12.3.7.3. Market Revenue and Forecast, by Source (2021-2033)
12.3.7.4. Market Revenue and Forecast, by Grid (2021-2033)
12.3.8. Rest of APAC
12.3.8.1. Market Revenue and Forecast, by Type (2021-2033)
12.3.8.2. Market Revenue and Forecast, by End-User (2021-2033)
12.3.8.3. Market Revenue and Forecast, by Source (2021-2033)
12.3.8.4. Market Revenue and Forecast, by Grid (2021-2033)
12.4. MEA
12.4.1. Market Revenue and Forecast, by Type (2021-2033)
12.4.2. Market Revenue and Forecast, by End-User (2021-2033)
12.4.3. Market Revenue and Forecast, by Source (2021-2033)
12.4.4. Market Revenue and Forecast, by Grid (2021-2033)
12.4.5. GCC
12.4.5.1. Market Revenue and Forecast, by Type (2021-2033)
12.4.5.2. Market Revenue and Forecast, by End-User (2021-2033)
12.4.5.3. Market Revenue and Forecast, by Source (2021-2033)
12.4.5.4. Market Revenue and Forecast, by Grid (2021-2033)
12.4.6. North Africa
12.4.6.1. Market Revenue and Forecast, by Type (2021-2033)
12.4.6.2. Market Revenue and Forecast, by End-User (2021-2033)
12.4.6.3. Market Revenue and Forecast, by Source (2021-2033)
12.4.6.4. Market Revenue and Forecast, by Grid (2021-2033)
12.4.7. South Africa
12.4.7.1. Market Revenue and Forecast, by Type (2021-2033)
12.4.7.2. Market Revenue and Forecast, by End-User (2021-2033)
12.4.7.3. Market Revenue and Forecast, by Source (2021-2033)
12.4.7.4. Market Revenue and Forecast, by Grid (2021-2033)
12.4.8. Rest of MEA
12.4.8.1. Market Revenue and Forecast, by Type (2021-2033)
12.4.8.2. Market Revenue and Forecast, by End-User (2021-2033)
12.4.8.3. Market Revenue and Forecast, by Source (2021-2033)
12.4.8.4. Market Revenue and Forecast, by Grid (2021-2033)
12.5. Latin America
12.5.1. Market Revenue and Forecast, by Type (2021-2033)
12.5.2. Market Revenue and Forecast, by End-User (2021-2033)
12.5.3. Market Revenue and Forecast, by Source (2021-2033)
12.5.4. Market Revenue and Forecast, by Grid (2021-2033)
12.5.5. Brazil
12.5.5.1. Market Revenue and Forecast, by Type (2021-2033)
12.5.5.2. Market Revenue and Forecast, by End-User (2021-2033)
12.5.5.3. Market Revenue and Forecast, by Source (2021-2033)
12.5.5.4. Market Revenue and Forecast, by Grid (2021-2033)
12.5.6. Rest of LATAM
12.5.6.1. Market Revenue and Forecast, by Type (2021-2033)
12.5.6.2. Market Revenue and Forecast, by End-User (2021-2033)
12.5.6.3. Market Revenue and Forecast, by Source (2021-2033)
12.5.6.4. Market Revenue and Forecast, by Grid (2021-2033)
Chapter 13. Company Profiles
13.1. Enel SpA
13.1.1. Company Overview
13.1.2. Product Offerings
13.1.3. Financial Performance
13.1.4. Recent Initiatives
13.2. Electricite De France SA
13.2.1. Company Overview
13.2.2. Product Offerings
13.2.3. Financial Performance
13.2.4. Recent Initiatives
13.3. State Power Investment Corporation
13.3.1. Company Overview
13.3.2. Product Offerings
13.3.3. Financial Performance
13.3.4. Recent Initiatives
13.4. E.ON SE
13.4.1. Company Overview
13.4.2. Product Offerings
13.4.3. Financial Performance
13.4.4. Recent Initiatives
13.5. Engie
13.5.1. Company Overview
13.5.2. Product Offerings
13.5.3. Financial Performance
13.5.4. Recent Initiatives
13.6. Huaneng Power International, Inc.
13.6.1. Company Overview
13.6.2. Product Offerings
13.6.3. Financial Performance
13.6.4. Recent Initiatives
13.7. Exelon Corp
13.7.1. Company Overview
13.7.2. Product Offerings
13.7.3. Financial Performance
13.7.4. Recent Initiatives
13.8. Endesa SA
13.8.1. Company Overview
13.8.2. Product Offerings
13.8.3. Financial Performance
13.8.4. Recent Initiatives
13.9. Datang International Power Generation Company Limited
13.9.1. Company Overview
13.9.2. Product Offerings
13.9.3. Financial Performance
13.9.4. Recent Initiatives
13.10. Inter RAO UES
13.10.1. Company Overview
13.10.2. Product Offerings
13.10.3. Financial Performance
13.10.4. Recent Initiatives
Chapter 14. Research Methodology
14.1. Primary Research
14.2. Secondary Research
14.3. Assumptions
Chapter 15. Appendix
15.1. About Us
15.2. Glossary of Terms