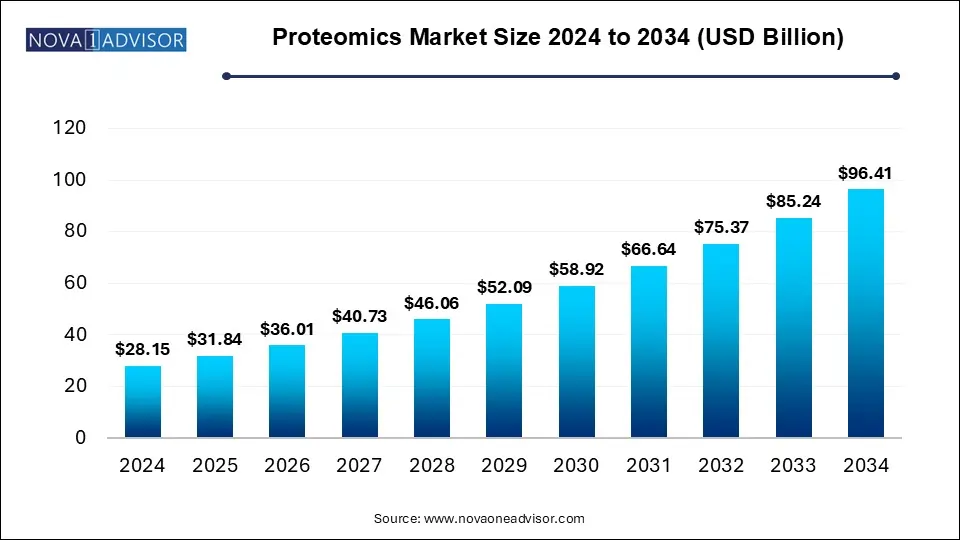
The proteomics market accounted for USD 28.15 billion in 2024 and is expected to hit around USD 96.41 billion by 2034, growing with a CAGR of 13.1% from 2025 to 2034. This market is growing due to advancements in technology, increasing demand for personalized medicine, rising R7D investments, and expanding applications in drug discovery and diagnostics.

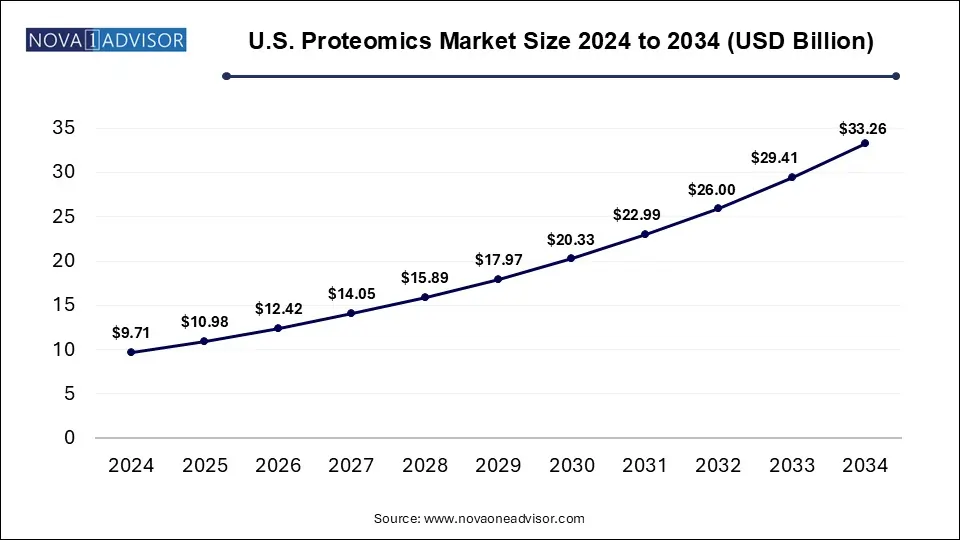
The U.S. Proteomics Market size was valued at USD 9.71 billion in 2024 and is expected to hit around USD 33.26 billion by 2034, growing at a CAGR of 11.84% from 2025 to 2034.

North America dominates the proteomics market in 2024, because of its robust research infrastructure, significant investments in the life sciences and well-established biotechnology and pharmaceutical industries. The area gains from sophisticated healthcare systems, the broad use of precision medicine and the strong demand for proteomics-based diagnostics and drug discovery. Mass spectrometry chromatography and bioinformatics tools continue to advance solidifying its dominance. Innovation and market expansion are further stimulated by partnerships between academic institutions and business leaders as well as by encouraging regulatory environments.
Asia Pacific is experiencing rapid growth in the defibrillator market driven by a growing emphasis on personalized medicine, growing research capabilities and rising healthcare investments. The market is growing as research of rising awareness of proteomics-based diagnostics the quick uptake of next generation sequencing and biomarker research. The area is a major center for proteomics research and development since it is also seeing a boom in contract research and manufacturing services. The proteomics market in this area is anticipated to maintain its sharp growth trajectory as the need for cutting edge healthcare solutions increases.
Proteomics Market Overview
The global proteomics market is experiencing significant growth, driven by advancements in mass spectrometry, chromatography, and bioinformatics, along with increasing demand for personalized medicine and biomarker discovery. Government funding and growing R&D expenditures by biotechnology and pharmaceutical firms are driving market growth. The rising incidence of chronic illnesses like cancer and neurological conditions where proteomics is essential for early diagnosis and focused treatment is another factor driving the market. The market is also growing as a result of growing applications in structural and functional proteomics drug discovery and the combination of AI and machine learning for data analysis. This market is expected to grow steadily over the next several years due to ongoing technological advancements and an increase in healthcare applications.
Market Driver
Advancements in Technology
Rapid progress in mass spectrometry chromatography electrophoresis and bioinformatics tools is helping the proteomics market. The accuracy sensitivity and throughput of protein analysis have all increased dramatically because of these developments making it possible for scientists to more successfully investigate intricate biological systems. Proteomics has become increasingly popular across a range of applications thanks to the development of high-resolution instruments and automation in sample preparation. New paths for early disease detection and personalized medicine are also being made possible by developments in single-cell proteomics and nano proteomics.
Rising Demand for Personalized Medicine and Targeted Therapies
Proteomics is a key component of personalized medicine which uses it to find disease-specific biomarkers that inform patient-specific treatment plans. Proteomics aids in predicting drug response, streamlining treatment plans, and reducing side effects. Pharmaceutical companies are using proteomics more and more to develop targeted therapies as precision medicine becomes more prevalent especially in the fields of immunology neurodegenerative diseases and oncology. The need for sophisticated proteomics methods is being driven by the expanding availability of tailored diagnostic tools and treatments.
Expansion of Drug Discovery and Development Applications
By discovering new therapeutic targets and clarifying disease pathways, proteomics is significantly contributing to the acceleration of drug discovery. By examining protein interactions and post translation modifications high throughput proteomics techniques are assisting pharmaceutical companies in creating safer and more effective medications. To improve drug efficiency proteomics is also being utilized in the manufacturing of biologics such as recombinant proteins and monoclonal antibodies. Proteomics solutions are anticipated to become more and more in demand as the pharmaceutical industry keeps investing in targeted therapies.
| Report Coverage | Details |
| Market Size in 2025 | USD 31.84 Billion |
| Market Size by 2034 | USD 96.41 Billion |
| Growth Rate From 2025 to 2034 | CAGR of 13.1% |
| Base Year | 2024 |
| Forecast Period | 2025-2034 |
| Segments Covered | Product & service, Application, Technology, Region |
| Market Analysis (Terms Used) | Value (US$ Million/Billion) or (Volume/Units) |
| Regional scope | North America; Europe; Asia Pacific; Latin America; MEA |
| Key Companies Profiled | Illumina, Inc.; Agilent Technologies, Inc.; Bio-Rad Laboratories, Inc.; Thermo Fisher Scientific, Inc.; Bruker Corporation; F. Hoffmann-La Roche Ltd.; Waters Corporation; Merck KGaA; Danaher; Standard BioTools Inc. |
Market Opportunity
Expansion into Multi Omics Research and Systems Biology
A more thorough knowledge of biological systems is being made possible by the combination of proteomics transcriptomics metabolomics and genomics. Research on multi omics is propelling advancements in immune system disorders, regenerative medicine and cancer biology. Businesses creating integrated multi omics platforms and software solutions will have enormous growth potential as researchers tackle disease from a holistic perspective.
Market Challenge
High Cost of Proteomics Technologies
Advanced equipment like mass spectrometers chromatography systems and bioinformatics tools are necessary for proteomics research but they are costly to buy and maintain. Many small research labs and biotech startups cannot afford proteomics due to the high costs of reagents sample preparation and data analysis software. Adoption is hampered by this financial barrier especially in developing nations with little funding for scientific research.
Limited Clinical Translation of Proteomics Discoveries
The discovery of biomarkers has benefited greatly from proteomics but relatively few proteomics-based biomarkers have made a leap from research to clinical use. Their use in diagnostic and personalized medicine is slowed by issues with inter individual variability biomarkers validation and regulatory barriers. Due to problems with sensitivity specificity and practicality many promising biomarkers never reach clinical relevance.
The Reagents & consumables segment held the largest share in 2024 because of their crucial role in a variety of proteomics techniques including electrophoresis chromatography and mass spectrometry. High-quality reagents such as assay kits buffers and antibodies are constantly needed in clinical and research settings which guarantees a consistent demand. The development of this market is also fueled by the growing use of proteomics in biomarker and drug discovery research. Its dominance in the market is also attributed to developments in reagent formulations and the introduction of specialized protein analysis kits.
The Service segment is expected to grow at the fastest rate. Proteomics research is being increasingly outsourced to contract research organizations (CROs) and specialized service providers by pharmaceutical biotech and research institutions. There is a growing need for proteomics services due to the intricacy of proteomics workflows and the requirement for proficiency in data analysis and interpretation. This segment's rapid growth is also being driven by an increase in partnerships between industry players and academic institutions for research on personalized medicine and biomarker discovery.
The drug discovery segment held the largest share in 2024. Because proteomics is widely used by biotechnology and pharmaceutical companies for biomarker discovery target validation and identification. Especially in the cases of cancer neurodegenerative diseases and autoimmune disorders proteomics techniques offer vital insights into disease mechanisms and aid in the discovery of new therapeutic targets. The importance of proteomics in drug development is further reinforced by the rising demand for precision medicine monoclonal antibodies and biologics. Proteomics integration with AI and machine learning is also improving drug discovery's effectiveness preserving this market's leadership.
Clinical diagnostics segment is expected to grow at the fastest rate motivated by the growing use of biomarkers based on proteomics for prognosis disease diagnosis and treatment tracking. Proteomics is essential for early disease detection in infectious cardiovascular and cancerous conditions. Growth is also being accelerated by the move toward personalized medicine where proteomics helps customize treatments based on a patient's unique protein profile. The fastest-growing market is proteomics, which is seeing an expansion in clinical applications due to developments in high-throughput proteomics technologies and rising regulatory approvals for diagnostic tests based on proteomics.
Spectrometry segment held the largest share in 2024. Driven by its great sensitivity, precision and capacity to examine intricate protein structures and post translational changes. Mass spectrometry is frequently used for protein identification and quantification in clinical diagnostics, proteomics research and drug discovery. Its status as the top proteomics technology has been strengthened by ongoing developments in mass spectrometry technology such as hybrid and high-resolution systems. Mass spectrometry's dominance in the market is being further reinforced by its integration with automation and AI driven analytics.
Next generation sequencing segment is expected to grow at the fastest rate because it can incorporate proteogenomic research. Protein coding genes can be sequenced thanks to NGS which makes it easier to find new proteins and mutations linked to disease. NGS and proteomics work together to provide deeper understanding of gene expression protein function and disease mechanisms' which makes it an important tool in personalized medicine. The need for NGS based proteomics solutions is growing rapidly due to the increasing popularity of multi omics approaches in research and clinical applications.
This report forecasts revenue growth at country levels and provides an analysis of the latest industry trends in each of the sub-segments from 2021 to 2034. For this study, Nova one advisor, Inc. has segmented the Proteomics Market
By Product & Services
By Application
By Technology
By Regional