Pyrogen Testing Market Size, Share & Trends Analysis Report By Product (Instruments, Consumables, Services), By Test Type (LAL Test, In Vitro Pyrogen Test, Rabbit Test), By End Use, By Region,- Industry Analysis, Share, Growth, Regional Outlook and Forecasts, 2024-2034

Pyrogen Testing Market Size and Growth

The pyrogen testing market size was exhibited at USD 1.55 billion in 2024 and is projected to hit around USD 3.52 billion by 2034, growing at a CAGR of 8.55% during the forecast period 2024 to 2034.
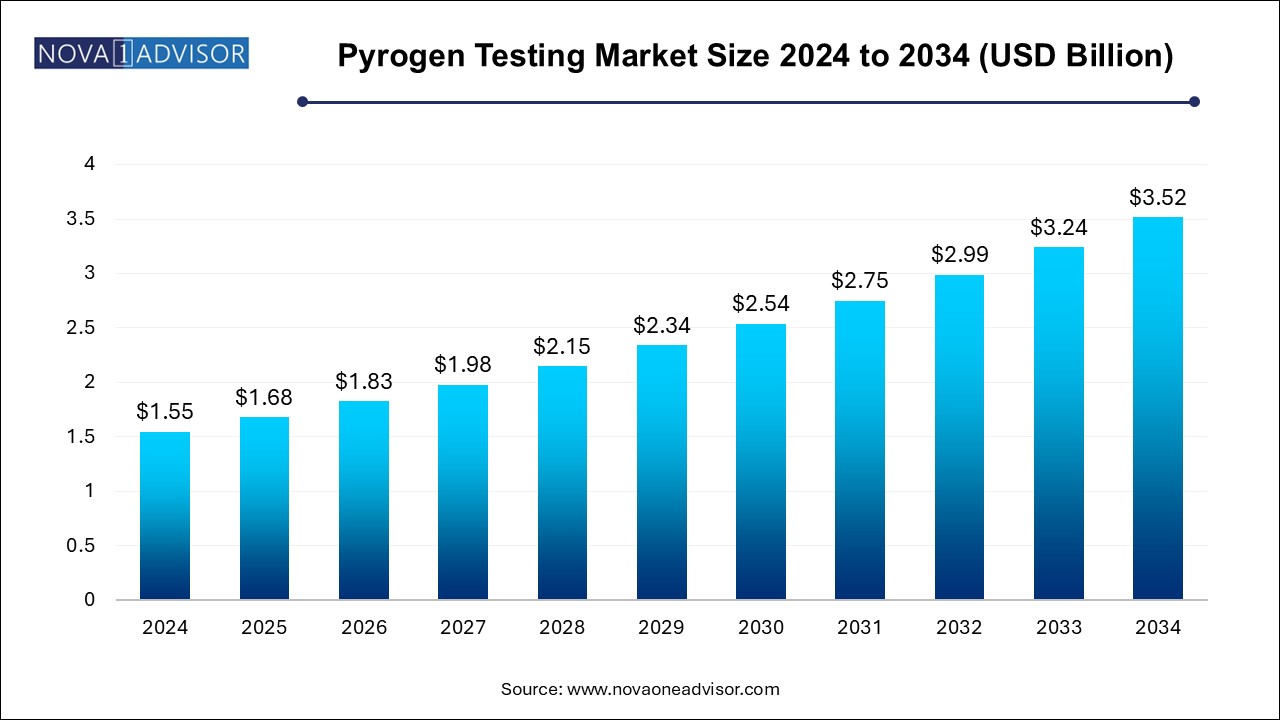
Pyrogen Testing Market Size 2024 To 2034

Pyrogen Testing Market Key Takeaways:

  • In 2024, the consumables segment was the largest segment with a share of 55.1%, and is estimated to maintain its dominance during the forecast period.
  • The LAL test segment dominated the market with a share of 47% in 2024.
  • The pharmaceutical and biotechnology companies dominated the overall market with a share of 59.96% in 2024.
  • The medical devices companies' segment is expected to grow significantly over the forecast period.
  • North America dominated the pyrogen testing market with the largest revenue share of 40.9% in 2024.

Report Scope of Pyrogen Testing Market

 Report Coverage  Details
Market Size in 2025 USD 1.68 Billion
Market Size by 2034 USD 3.52 Billion
Growth Rate From 2024 to 2034 CAGR of 8.55%
Base Year 2024
Forecast Period 2024-2034
Segments Covered Product, Test Type, End-use, Region
Market Analysis (Terms Used) Value (US$ Million/Billion) or (Volume/Units)
Regional Covered North America, Europe, Asia Pacific, Latin America, MEA
Key Companies Profiled Charles River Laboratories; Ellab A/S; Merck KGaA; GenScript; bioMérieux SA; Lonza; Thermo Fisher Scientific, Inc.; Associates of Cape Cod, Inc.; FUJIFILM Wako Chemicals U.S.A. Corporation (Pyrostar)

Increasing demand for pyrogen testing products in the pharmaceutical and biotechnology industry is a major factor contributing to the growth of the market. Rapidly growing pharmaceutical and biotechnology industries and the escalating number of new therapeutics launches are expected to boost the demand for pyrogen testing products.

Increasing investment in R&D by the government and manufacturing companies for product development is one of the major factors contributing to the market's growth. New product development and launch is a key strategy acquired by manufacturers to maintain their dominance and to get a maximum revenue share in the sector. As stated by the European Federation of Pharmaceutical Industries and Associations (EFPIA), in 2024, the research-based pharmaceutical industry invested around USD 48.65 billion in R&D in Europe in 2022. Hence, the need for pyrogen testing products is anticipated to upsurge during the forecast period.

Furthermore, the market is driven by the increasing demand for therapeutic drugs. Several companies are actively involved in developing new drug therapies. For instance, in 2024, the FDA  approved 55 new drugs. Pyrogen testing in drug development specifies the absence or presence of pyrogens in parenteral pharmaceutical products. Moreover, the sterility of any drug does not indicate that it is pyrogen-free. Therefore, drugs that are expected to be sterile must be tested for the presence of pyrogens to control fevered reactions in patients.

In addition, several regulatory bodies and governments are taking various initiatives to train and create awareness about pyrogen testing. For instance, in February 2024, the European Directorate for the Quality of Medicines & Healthcare (EDQM) and the European Partnership for Alternative Approaches to Animal Testing (EPAA - European Commission) conducted an online training session to discuss the future of pyrogenicity testing by eliminating the rabbit pyrogen test.

Pyrogen Testing Market By Product Insights

Based on product, the pyrogen testing industry is segmented into consumables, instruments, and services. In 2024, the consumables segment was the largest segment with a share of 55.1%, and is estimated to maintain its dominance during the forecast period. The rising prevalence of chronic diseases boosts the production of pharmaceuticals, biologics, and medical device products. For instance, according to the WHO  article published in September 2024, approximately 4.0 million deaths occur due to chronic respiratory diseases. Hence, the increasing production of drugs to cure these diseases drives the application of pyrogen testing consumables, including kits and reagents.

Instruments segment is expected to show significant growth during the forecast period owing to the technological advancement in products. For instance, the PyroDetect System is a verified non-animal substitute to replace the rabbit test that quality high-quality in vitro detection of both non-endotoxin and endotoxin contamination.

Pyrogen Testing Market By Test Type Insights

Based on test type, the pyrogen testing industry has been segmented into LAL tests, in vitro tests, and rabbit tests. The LAL test segment dominated the market with a share of 47.0% in 2024. The growth is attributed to the rising demand for animal-free detection tests and their high reproducibility and reliability during detection. For instance, In February 2024, the European Pharmacopoeia (Ph. Eur.) published 59 texts involving the rabbit pyrogen test replacement approach for public consultation in Pharmeuropa 35.1. LAL test is further categorized into turbidimetric, chromogenic, and gel clot tests.
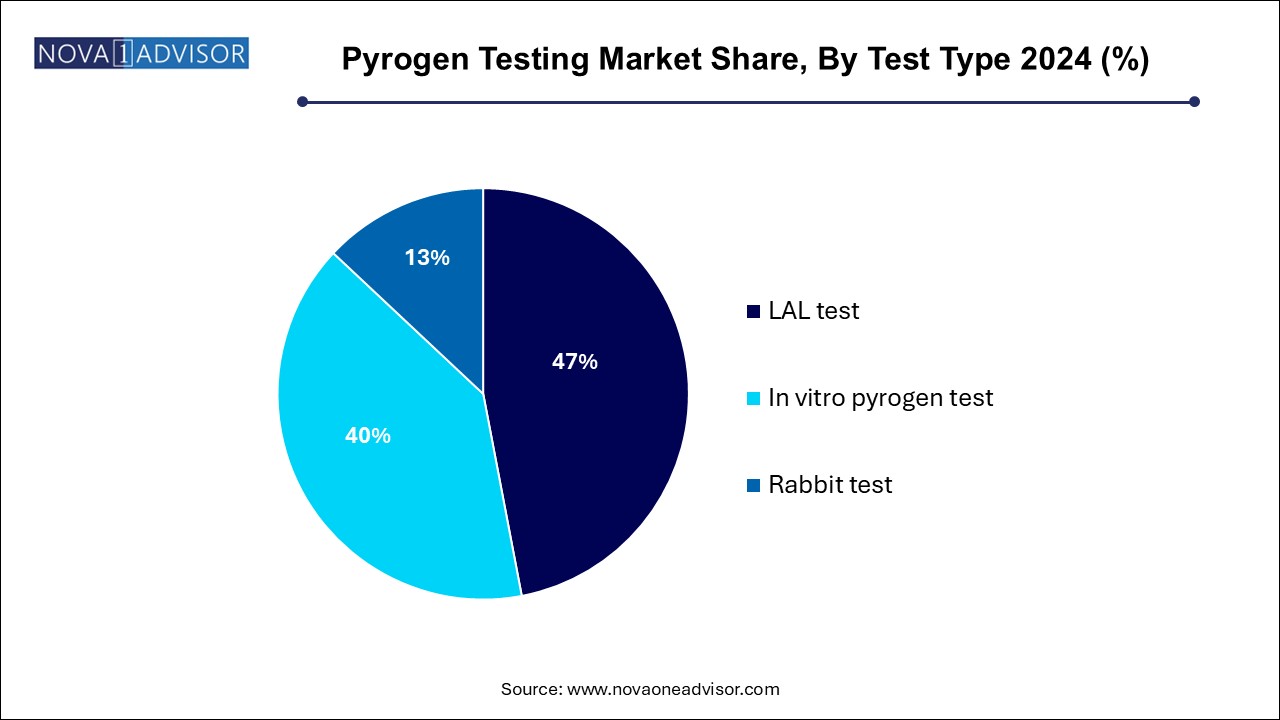
Pyrogen Testing Market Share, By Test Type 2024 (%)

Furthermore, the rabbit pyrogen test segment had a significant market share in the market in 2024. However, the growing use of animal-free tests is a dominant characteristic that could restrict the use of this test type to some degree in near future. The demand for animal-free tests is rising due to their capability to evaluate the product without damaging any living organisms.

Pyrogen Testing Market By End-use Insights

The pharmaceutical and biotechnology companies dominated the overall market with a share of 59.96% in 2024. The growth is attributed to the rising production of pharmaceuticals, biopharmaceuticals, and other biologic products. Pyrogen testing is crucial in confirming parenteral pharmaceutical product safety. It is a mandatory test to prevent serious fever reactions caused by pyrogenic substances. Hence, the increasing need for pyrogen testing consumables and instruments in these companies propels the growth of the pyrogen testing market.

The medical devices companies' segment is expected to grow significantly over the forecast period. The consideration of applying pyrogen testing for medical devices arises from their potential indirect or direct exposure to human blood cells. Pyrogenicity tests are imperative to assess the safety of products that come into direct or indirect contact with blood circulation, cerebrospinal fluid (CSF), the lymphatic system, and those that interact systemically with the human body. Official methods for assessing the medical devices' pyrogenicity and materials include the in vitro bacterial endotoxin test and the in vivo rabbit pyrogenicity test.

Pyrogen Testing Market By Regional Insights

North America dominated the pyrogen testing market with the largest revenue share of 40.9% in 2024. The growth is attributed to the rising number of chronic diseases needing developments in drug therapy. Also, North America's highly developed healthcare & research infrastructure and a large focus on new drug development have fueled the regional market growth.

U.S. Pyrogen Testing Market Trends

The market in the U.S. is expected to grow over the forecast period. The country’s growth is attributed to key players, such as Pfizer Inc., F. Hoffmann-La Roche AG, Merck Group, Celgene Corp., and Amgen Inc. who operate in the pyrogen testing market. Furthermore, several companies in the U.S. manufacture pharmaceuticals, which further boosts the application of pyrogen tests in the country.

Europe's pyrogen testing market was identified as a lucrative region in this industry. The growth is attributed to the exponentially growing biotechnology and pharmaceutical industries. Furthermore, in 2021, the European Pharmacopoeia Commission (EPC), announced an undertaking of process to eliminate rabbit pyrogen test (RPT) in the next five years.

UK Pyrogen Testing Market Trends

The market in the UK is anticipated to expand over the forecast period due to a significant approval of drugs. For instance, in 2021, according to the MHRA , 35 new drugs were approved from the UK.

France Pyrogen Testing Market Trends

The market in France is projected to grow over the forecast period. The growth is attributed to the growing initiatives in the therapeutic drugs field. The country  is undertaking several initiatives to increase the access of drugs to the targeted patients in France.

Germany Pyrogen Testing Market Trends

The market in Germany is anticipated to grow over the forecast period due to the presence of several key players. Moreover, Merck KGaA, a well-known player in the pyrogen testing industry, has its headquarters in Darmstadt, Germany.

Asia Pacific is projected to exhibit the significant growth rate during the forecast period, owing to untapped opportunities in this region. Many manufacturers target Asian countries, such as China & India, for drug discovery, development, and production. In addition, clinical research organizations are focusing on Asian countries for clinical trials. The availability of less stringent government regulations for drug development, the vast genome pool, and the rapidly developing healthcare infrastructure are some of the major factors responsible for the growth of the sector in this region.

China Pyrogen Testing Market Trends

The market in China is expected to grow over the forecast period. The growth is attributed to the increasing presence of key players in the country, owing to the reasonable manufacturing cost. For instance, in March 2022, Lonza , one of the market players, expanded its manufacturing plant of active pharmaceutical ingredients (API) in China.

Japan Pyrogen Testing Market Trends

The market in Japan is expected to grow over the forecast period due increasing number of drug approvals, favorable regulations, and several key players operating in the country. Japan  focuses on introducing favorable regulations for new drugs developed in other countries. It will increase the number of foreign drug approvals in Japan, thereby increasing the application of pyrogen testing in the country.

Some of the prominent players in the pyrogen testing market include:

  • Charles River Laboratories
  • Ellab A/S
  • Merck KGaA
  • GenScript Biotech
  • bioMérieux SA
  • Lonza Group
  • Thermo Fisher Scientific, Inc.
  • Associates of Cape Cod, Inc.
  • FUJIFILM Wako Chemicals U.S.A. Corporation (Pyrostar )

Pyrogen Testing Market Recent Developments

  • In October 2024, Lonza  announced the launch of two monocyte activation test (MAT) systems: PyroCell MAT Human Serum (HS) Rapid System and PyroCell MAT Rapid System.

  • In September 2024, Intravacc announced a collaboration with Sanquin Diagnostic Services to optimize the in vitro Monocyte Activation Test (MAT) and replace the animal pyrogen test for OMV vaccines.

  • In June 2024, Ellab  A/S announced its acquisition by Novo Holdings. This acquisition will expand Novo Holdings' business in the pyrogen testing market.

Segments Covered in the Report

This report forecasts revenue growth at country levels and provides an analysis of the latest industry trends in each of the sub-segments from 2021 to 2034. For this study, Nova one advisor, Inc. has segmented the pyrogen testing market

By Product

  • Consumables
  • Instruments
  • Services

By Test Type

  • LAL test
    • Chromogenic test
    • Turbidimetric test
    • Gel clot test
  • In vitro pyrogen test        
  • Rabbit test

By End-use

  • Pharmaceutical and biotechnology companies
  • Medical devices companies
  • Others

By Regional

  • North America
  • Europe
  • Asia Pacific
  • Latin America
  • Middle East and Africa (MEA)

Frequently Asked Questions

The pyrogen testing market size was exhibited at USD 1.55 billion in 2024 and is projected to hit around USD 3.52 billion by 2034, growing at a CAGR of 8.55% during the forecast period 2024 to 2034.

North America dominated the pyrogen testing market with a share of 40.87% in 2023. This is attributable to the presence of many large biotechnology and biopharmaceutical companies, rising number of chronic diseases needing developments in drug therapy. Also, North America\'s highly developed healthcare & research infrastructure and a large focus on new drug development have fueled the regional market growth.

Some key players operating in the pyrogen testing market include Charles River Laboratories; Ellab A/S; Merck KGaA; GenScript; bioMérieux SA; Lonza; Thermo Fisher Scientific, Inc.; Associates of Cape Cod, Inc.; FUJIFILM Wako Chemicals U.S.A. Corporation (Pyrostar).

Key factors that are driving the market growth include increasing demand for pyrogen testing products in the pharmaceutical and biotechnology industry is a major factor contributing to the growth of the market. Rapidly growing pharmaceutical and biotechnology industries along with the escalating number of new therapeutics launches are expected to boost the demand for pyrogen testing products.

Chapter 1. Methodology and Scope

1.1. Market Segmentation & Scope

1.2. Segment Definitions

1.2.1. Product

1.2.2. Test Type

1.2.3. End Use

1.2.4. Regional scope

1.2.5. Estimates and forecasts timeline

1.3. Research Methodology

1.4. Information Procurement

1.4.1. Purchased database

1.4.2. internal database

1.4.3. Secondary sources

1.4.4. Primary research

1.4.5. Details of primary research

1.4.5.1. Data for primary interviews in North America

1.4.5.2. Data for primary interviews in Europe

1.4.5.3. Data for primary interviews in Asia Pacific

1.4.5.4. Data for primary interviews in Latin America

1.4.5.5. Data for Primary interviews in MEA

1.5. Information or Data Analysis

1.5.1. Data analysis models

1.6. Market Formulation & Validation

1.7. Model Details

1.7.1. Commodity flow analysis (Model 1)

1.7.2. Approach 1: Commodity flow approach

1.7.3. Volume price analysis (Model 2)

1.7.4. Approach 2: Volume price analysis

1.8. List of Secondary Sources

1.9. List of Primary Sources

1.10. Objectives

Chapter 2. Executive Summary

2.1. Market Outlook

2.2. Segment Outlook

2.2.1. Product outlook

2.2.2. Test type outlook

2.2.3. End use outlook

2.2.4. Regional outlook

2.3. Competitive Insights

Chapter 3. Pyrogen Testing Market Variables, Trends & Scope

3.1. Market Lineage Outlook

3.1.1. Parent market outlook

3.1.2. Related/ancillary market outlook

3.2. Market Dynamics

3.2.1. Market driver analysis

3.2.1.1. Rising demand for therapeutic drugs

3.2.1.2. Growing investment in R&D

3.2.1.3. Increasing prevalence of chronic disease

3.2.2. Market restraint analysis

3.2.2.1. Stringent government regulations

3.3. Pyrogen Testing Market Analysis Tools

3.3.1. Industry Analysis - Porter’s

3.3.1.1. Supplier power

3.3.1.2. Buyer power

3.3.1.3. Substitution threat

3.3.1.4. Threat of new entrant

3.3.1.5. Competitive rivalry

3.3.2. PESTEL Analysis

3.3.2.1. Political landscape

3.3.2.2. Technological landscape

3.3.2.3. Economic landscape

3.3.3. Pricing Analysis

Chapter 4. Pyrogen Testing Market: Product Estimates & Trend Analysis

4.1. Product Market Share, 2024 & 2034

4.2. Segment Dashboard

4.3. Global Pyrogen Testing Market by Product Outlook

4.4. Market Size & Forecasts and Trend Analyses, 2021 to 2034 for the following

4.4.1. Consumables

4.4.1.1. Market estimates and forecasts 2021 to 2034 (USD Million)

4.4.2. Instruments

4.4.2.1. Market estimates and forecasts 2021 to 2034 (USD Million)

4.4.3. Services

4.4.3.1. Market estimates and forecasts 2021 to 2034 (USD Million)

Chapter 5. Pyrogen Testing Market: Test Type Estimates & Trend Analysis

5.1. Test Type Market Share, 2024 & 2034

5.2. Segment Dashboard

5.3. Global Pyrogen Testing Market by Test Type Outlook

5.4. Market Size & Forecasts and Trend Analyses, 2021 to 2034 for the following

5.4.1. LAL test

5.4.1.1. Market estimates and forecasts 2021 to 2034 (USD Million)

5.4.1.2. Chromogenic test

5.4.1.2.1. Market estimates and forecasts 2021 to 2034 (USD Million)

5.4.1.3. Turbidimetric test

5.4.1.3.1. Market estimates and forecasts 2021 to 2034 (USD Million)

5.4.1.4. Gel clot test

5.4.1.4.1. Market estimates and forecasts 2021 to 2034 (USD Million)

5.4.2. In vitro pyrogen test

5.4.2.1. Market estimates and forecasts 2021 to 2034 (USD Million)

5.4.3. Rabbit test

5.4.3.1. Market estimates and forecasts 2021 to 2034 (USD Million)

Chapter 6. Pyrogen Testing Market: End Use Estimates & Trend Analysis

6.1. End Use Market Share, 2024 & 2034

6.2. Segment Dashboard

6.3. Global Pyrogen Testing Market by End Use Outlook

6.4. Market Size & Forecasts and Trend Analyses, 2021 to 2034 for the following

6.4.1. Pharmaceutical & biotechnology companies

6.4.1.1. Market estimates and forecasts 2021 to 2034 (USD Million)

6.4.2. Medical devices companies

6.4.2.1. Market estimates and forecasts 2021 to 2034 (USD Million)

6.4.3. Others

6.4.3.1. Market estimates and forecasts 2021 to 2034 (USD Million)

Chapter 7. Pyrogen Testing Market: Regional Estimates & Trend Analysis

7.1. Regional Market Share Analysis, 2024 & 2034

7.2. Regional Market Dashboard

7.3. Global Regional Market Snapshot

7.4. Market Size, & Forecasts Trend Analysis, 2021 to 2034:

7.5. North America

7.5.1. U.S.

7.5.1.1. Key country dynamics

7.5.1.2. Regulatory framework

7.5.1.3. Competitive scenario

7.5.1.4. U.S. market estimates and forecasts 2021 to 2034 (USD Million)

7.5.2. Canada

7.5.2.1. Key country dynamics

7.5.2.2. Regulatory framework

7.5.2.3. Competitive scenario

7.5.2.4. Canada market estimates and forecasts 2021 to 2034 (USD Million)

7.6. Europe

7.6.1. UK

7.6.1.1. Key country dynamics

7.6.1.2. Regulatory framework

7.6.1.3. Competitive scenario

7.6.1.4. UK market estimates and forecasts 2021 to 2034 (USD Million)

7.6.2. Germany

7.6.2.1. Key country dynamics

7.6.2.2. Regulatory framework

7.6.2.3. Competitive scenario

7.6.2.4. Germany market estimates and forecasts 2021 to 2034 (USD Million)

7.6.3. France

7.6.3.1. Key country dynamics

7.6.3.2. Regulatory framework

7.6.3.3. Competitive scenario

7.6.3.4. France market estimates and forecasts 2021 to 2034 (USD Million)

7.6.4. Italy

7.6.4.1. Key country dynamics

7.6.4.2. Regulatory framework

7.6.4.3. Competitive scenario

7.6.4.4. Italy market estimates and forecasts 2021 to 2034 (USD Million)

7.6.5. Spain

7.6.5.1. Key country dynamics

7.6.5.2. Regulatory framework

7.6.5.3. Competitive scenario

7.6.5.4. Spain market estimates and forecasts 2021 to 2034 (USD Million)

7.6.6. Norway

7.6.6.1. Key country dynamics

7.6.6.2. Regulatory framework

7.6.6.3. Competitive scenario

7.6.6.4. Norway market estimates and forecasts 2021 to 2034 (USD Million)

7.6.7. Sweden

7.6.7.1. Key country dynamics

7.6.7.2. Regulatory framework

7.6.7.3. Competitive scenario

7.6.7.4. Sweden market estimates and forecasts 2021 to 2034 (USD Million)

7.6.8. Denmark

7.6.8.1. Key country dynamics

7.6.8.2. Regulatory framework

7.6.8.3. Competitive scenario

7.6.8.4. Denmark market estimates and forecasts 2021 to 2034 (USD Million)

7.7. Asia Pacific

7.7.1. Japan

7.7.1.1. Key country dynamics

7.7.1.2. Regulatory framework

7.7.1.3. Competitive scenario

7.7.1.4. Japan market estimates and forecasts 2021 to 2034 (USD Million)

7.7.2. China

7.7.2.1. Key country dynamics

7.7.2.2. Regulatory framework

7.7.2.3. Competitive scenario

7.7.2.4. China market estimates and forecasts 2021 to 2034 (USD Million)

7.7.3. India

7.7.3.1. Key country dynamics

7.7.3.2. Regulatory framework

7.7.3.3. Competitive scenario

7.7.3.4. India market estimates and forecasts 2021 to 2034 (USD Million)

7.7.4. Australia

7.7.4.1. Key country dynamics

7.7.4.2. Regulatory framework

7.7.4.3. Competitive scenario

7.7.4.4. Australia market estimates and forecasts 2021 to 2034 (USD Million)

7.7.5. South Korea

7.7.5.1. Key country dynamics

7.7.5.2. Regulatory framework

7.7.5.3. Competitive scenario

7.7.5.4. South Korea market estimates and forecasts 2021 to 2034 (USD Million)

7.7.6. Thailand

7.7.6.1. Key country dynamics

7.7.6.2. Regulatory framework

7.7.6.3. Competitive scenario

7.7.6.4. Thailand market estimates and forecasts 2021 to 2034 (USD Million)

7.8. Latin America

7.8.1. Brazil

7.8.1.1. Key country dynamics

7.8.1.2. Regulatory framework

7.8.1.3. Competitive scenario

7.8.1.4. Brazil market estimates and forecasts 2021 to 2034 (USD Million)

7.8.2. Mexico

7.8.2.1. Key country dynamics

7.8.2.2. Regulatory framework

7.8.2.3. Competitive scenario

7.8.2.4. Mexico market estimates and forecasts 2021 to 2034 (USD Million)

7.8.3. Argentina

7.8.3.1. Key country dynamics

7.8.3.2. Regulatory framework

7.8.3.3. Competitive scenario

7.8.3.4. Argentina market estimates and forecasts 2021 to 2034 (USD Million)

7.9. MEA

7.9.1. South Africa

7.9.1.1. Key country dynamics

7.9.1.2. Regulatory framework

7.9.1.3. Competitive scenario

7.9.1.4. South Africa market estimates and forecasts 2021 to 2034 (USD Million)

7.9.2. Saudi Arabia

7.9.2.1. Key country dynamics

7.9.2.2. Regulatory framework

7.9.2.3. Competitive scenario

7.9.2.4. Saudi Arabia market estimates and forecasts 2021 to 2034 (USD Million)

7.9.3. UAE

7.9.3.1. Key country dynamics

7.9.3.2. Regulatory framework

7.9.3.3. Competitive scenario

7.9.3.4. UAE market estimates and forecasts 2021 to 2034 (USD Million)

7.9.4. Kuwait

7.9.4.1. Key country dynamics

7.9.4.2. Regulatory framework

7.9.4.3. Competitive scenario

7.9.4.4. Kuwait market estimates and forecasts 2021 to 2034 (USD Million)

Chapter 8. Competitive Landscape

8.1. Recent Developments & Impact Analysis, By Key Market Participants

8.2. Company/Competition Categorization

8.3. Vendor Landscape

8.3.1. List of key distributors and channel partners

8.3.2. Key customers

8.3.3. Key company market share analysis, 2023

8.3.4. Charles River Laboratories

8.3.4.1. Company overview

8.3.4.2. Financial performance

8.3.4.3. Product benchmarking

8.3.4.4. Strategic initiatives

8.3.5. Ellab A/S

8.3.5.1. Company overview

8.3.5.2. Financial performance

8.3.5.3. Product benchmarking

8.3.5.4. Strategic initiatives

8.3.6. Merck KGaA

8.3.6.1. Company overview

8.3.6.2. Financial performance

8.3.6.3. Product benchmarking

8.3.6.4. Strategic initiatives

8.3.7. GenScript

8.3.7.1. Company overview

8.3.7.2. Financial performance

8.3.7.3. Product benchmarking

8.3.7.4. Strategic initiatives

8.3.8. bioMérieux SA

8.3.8.1. Company overview

8.3.8.2. Financial performance

8.3.8.3. Product benchmarking

8.3.8.4. Strategic initiatives

8.3.9. Lonza

8.3.9.1. Company overview

8.3.9.2. Financial performance

8.3.9.3. Product benchmarking

8.3.9.4. Strategic initiatives

8.3.10. Thermo Fisher Scientific, Inc.

8.3.10.1. Company overview

8.3.10.2. Financial performance

8.3.10.3. Product benchmarking

8.3.10.4. Strategic initiatives

8.3.11. Associates of Cape Cod, Inc.

8.3.11.1. Company overview

8.3.11.2. Financial performance

8.3.11.3. Product benchmarking

8.3.11.4. Strategic initiatives

8.3.12. FUJIFILM Wako Chemicals U.S.A. Corporation (Pyrostar)

8.3.12.1. Company overview

8.3.12.2. Financial performance

8.3.12.3. Product benchmarking

8.3.12.4. Strategic initiatives

Proceed To Buy

USD 4500
USD 3800
USD 1900
USD 1200

Customization Offered

  • check-img Cross-segment Market Size and Analysis for Mentioned Segments
  • check-imgAdditional Company Profiles (Upto 5 With No Cost)
  • check-img Additional Countries (Apart From Mentioned Countries)
  • check-img Country/Region-specific Report
  • check-img Go To Market Strategy
  • check-imgRegion Specific Market Dynamics
  • check-imgRegion Level Market Share
  • check-img Import Export Analysis
  • check-imgProduction Analysis
  • check-imgOthers