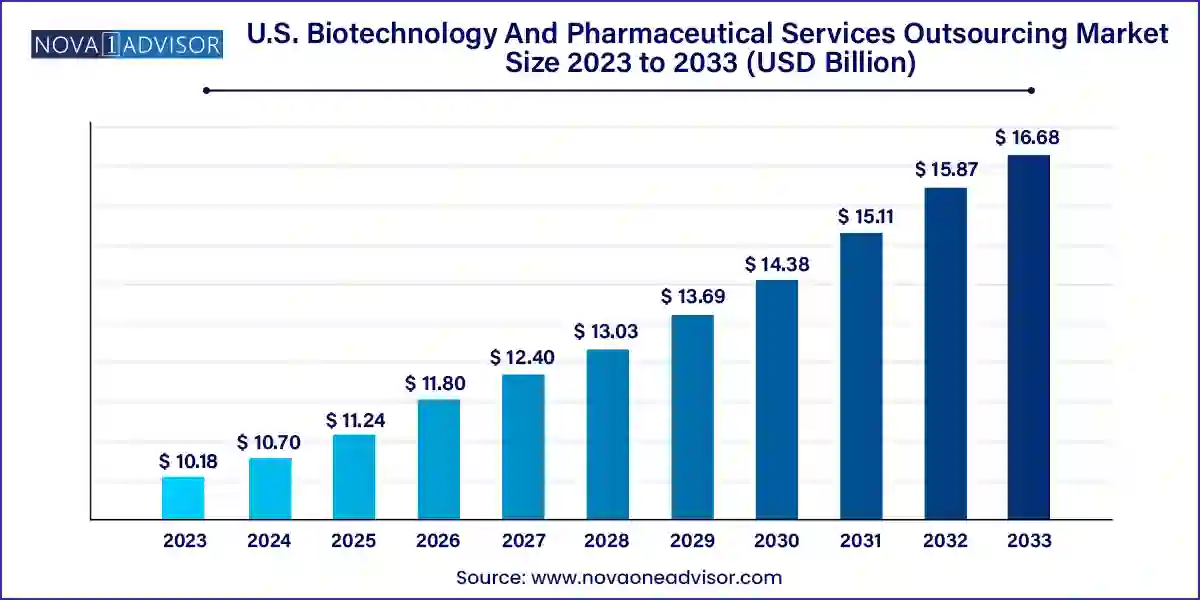
The U.S. biotechnology and pharmaceutical services outsourcing market size was exhibited at USD 10.18 billion in 2023 and is projected to hit around USD 16.68 billion by 2033, growing at a CAGR of 5.06% during the forecast period 2024 to 2033.

The U.S. biotechnology and pharmaceutical services outsourcing market is an essential extension of the nation's robust life sciences ecosystem. With rising pressure on pharmaceutical and biotech companies to deliver breakthrough therapies at a faster pace and lower cost, the outsourcing of critical services has transitioned from a cost-saving tactic to a strategic necessity. Companies are leveraging external expertise to streamline regulatory compliance, accelerate clinical development, and optimize product design and lifecycle management.
In the current biopharmaceutical landscape, time-to-market has become a crucial differentiator. Drug developers face increasing challenges such as complex regulatory pathways, high R&D expenditures, and the need to adhere to stringent quality standards. Outsourcing partners provide not only operational efficiency but also access to global regulatory knowledge, therapeutic area expertise, and advanced technologies. This makes them invaluable collaborators in the innovation and commercialization journey.
The rise of personalized medicine, cell and gene therapies, and biologics has further amplified the complexity of drug development. As a result, the U.S. market is witnessing a significant uptick in demand for outsourcing services that can provide targeted solutions for unique development needs. From regulatory consulting and quality management to product maintenance and auditing, service providers are expanding their portfolios to meet the evolving needs of biopharmaceutical innovators.
Shift Toward Specialized Service Providers: Companies increasingly favor niche providers with expertise in specific therapeutic areas or regulatory domains.
Growing Focus on Regulatory Compliance: With evolving FDA guidelines, regulatory consulting and submissions are in high demand.
Increased Outsourcing of Early-Stage Research: More biotechs are outsourcing concept generation, strategy, and feasibility analysis to reduce upfront investment risks.
Rising Adoption of Virtual Clinical Trials: Technology-enabled decentralized trials are revolutionizing clinical development outsourcing.
Strategic Partnerships Over Traditional Contracts: Firms are seeking long-term, value-based collaborations instead of transactional outsourcing deals.
Technology Integration in Services: Use of AI, machine learning, and blockchain in regulatory affairs and quality audits is growing.
Expansion of Training and Education Services: Companies are increasingly outsourcing training programs to ensure teams remain updated with compliance and quality standards.
| Report Coverage | Details |
| Market Size in 2024 | USD 10.70 Billion |
| Market Size by 2033 | USD 16.68 Billion |
| Growth Rate From 2024 to 2033 | CAGR of 5.06% |
| Base Year | 2023 |
| Forecast Period | 2024-2033 |
| Segments Covered | End-use, Service |
| Market Analysis (Terms Used) | Value (US$ Million/Billion) or (Volume/Units) |
| Regional Scope | U.S. |
| Key Companies Profiled | AbbVie Inc.; Lifecore Biomedical, Inc.; IQVIA Inc.; Parexel International (MA) Corp.; Lachman Consultant Services; Covance, Inc.; Charles River Laboratory; PRA Health Sciences; Simtra (Baxter); Alcami Corp. |
One of the most compelling drivers in the U.S. biotechnology and pharmaceutical services outsourcing market is the escalating complexity and cost associated with drug development. Bringing a new drug to market can cost upwards of $2 billion and take over a decade of rigorous testing, validation, and regulatory approvals. This high cost and long timeline are becoming untenable for many mid-sized and small biotech firms. Even large pharmaceutical companies are feeling the pressure to improve efficiency and reduce overhead.
To tackle this, organizations are increasingly outsourcing R&D-related functions such as product design, development consulting, and regulatory affairs to specialized service providers. These outsourcing firms often possess advanced infrastructure and domain expertise, allowing them to conduct studies more quickly and at a fraction of the in-house cost. For instance, strategic partnerships with CROs (Contract Research Organizations) and consulting firms help mitigate risks associated with pipeline attrition and regulatory setbacks, ensuring that drug development remains on schedule and within budget.
Despite its numerous advantages, outsourcing in the biotech and pharmaceutical sectors is often met with concerns around data confidentiality and intellectual property (IP) security. These concerns are particularly pronounced in early-stage research and regulatory affairs, where sensitive data and proprietary methodologies are shared with third parties. A breach in confidentiality or misuse of IP can lead to significant competitive and financial losses.
Many companies remain cautious and restrict outsourcing to non-core areas due to the perceived risk of data leaks or IP infringement. Furthermore, navigating data security compliance under HIPAA and FDA 21 CFR Part 11 regulations adds to the burden. While leading outsourcing firms invest heavily in cybersecurity protocols and ethical compliance frameworks, hesitation persists, especially among companies with high-value biopharmaceutical assets. Overcoming these concerns requires mutual trust, robust NDAs, and transparent data management policies between sponsors and service providers.
The emergence of advanced therapies such as CAR-T cell therapies, gene editing, and RNA-based treatments is creating substantial new opportunities for outsourcing in the U.S. market. These therapies involve highly specialized development pathways and stringent regulatory scrutiny. As a result, biotech and pharmaceutical companies are increasingly relying on outsourcing partners to handle complex product development, manufacturing transfers, and quality control procedures.
Service providers with capabilities in process validation, regulatory documentation, and commercial support for biologics are in high demand. Moreover, consulting firms with expertise in strategic planning and FDA interactions for biologics are becoming invaluable allies. The rising pipeline of orphan drugs and biologics across the U.S. creates a fertile ground for the expansion of specialized outsourcing services. Companies that can adapt their offerings to meet the unique needs of advanced therapy developers stand to capture significant market share in the coming years.
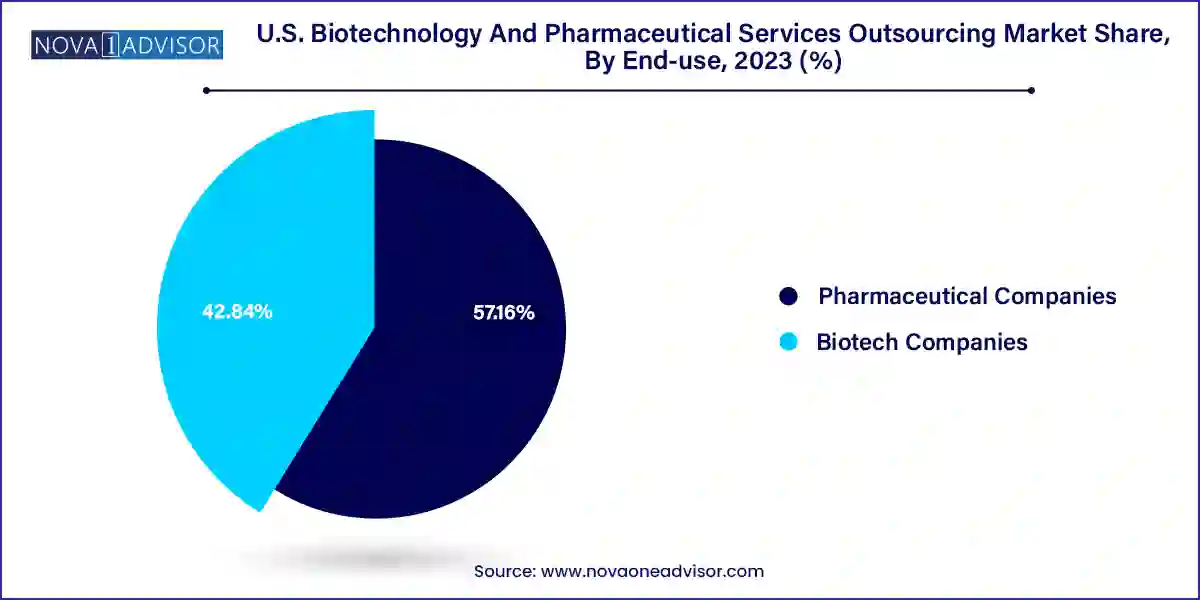
Pharmaceutical companies dominated the market, owing to their established outsourcing frameworks and higher volume of clinical trials. Large and mid-sized pharmaceutical firms have long been key clients for service outsourcing providers. With established portfolios and complex pipelines, these firms require support across multiple domains including regulatory submissions, auditing, and quality systems consulting. Outsourcing allows them to optimize internal resources and focus on core competencies such as drug discovery and strategic portfolio management. Additionally, due to their expansive global operations, pharmaceutical companies often require regulatory intelligence and consulting services for FDA, EMA, and other regulatory bodies.

Meanwhile, biotech companies are emerging as the fastest growing end-use segment due to the increasing number of startups and SMEs in the U.S. biotech ecosystem. These firms often operate with limited resources and seek outsourcing partners to bridge gaps in expertise, compliance, and clinical operations. Biotechs are particularly active in early-stage research and rely heavily on consulting services for concept generation, strategic planning, and regulatory pathway design. With venture capital and government grants fueling innovation, the demand for end-to-end outsourcing among biotechs is accelerating.
Regulatory affairs services emerged as the dominant segment, driven by the growing complexity of compliance in the U.S. regulatory environment. Services such as regulatory writing, submissions, and clinical trial applications are critical to ensuring that drug development timelines are not hindered by incomplete or non-compliant documentation. Given the increasing stringency of FDA guidelines and the high rate of regulatory scrutiny, companies are relying heavily on outsourcing experts to manage product registration, maintain compliance records, and handle regulatory interactions. Regulatory operations and submissions continue to be high-demand subsegments within this category.
On the other hand, product design and development services are the fastest growing segment, supported by rising demand for custom therapeutic platforms and patient-centric formulations. Outsourcing providers are increasingly involved in detailed design, process development, and manufacturing transfer services. These capabilities are particularly critical for companies working on biologics and advanced therapies, where precision and compliance are paramount. The integration of product design with commercial scalability is drawing pharma and biotech firms toward outsourcing partners that can offer a full spectrum of support from R&D to launch.
The U.S. remains the largest and most mature market for biotechnology and pharmaceutical services outsourcing. With a vibrant ecosystem of pharmaceutical giants, innovative biotech firms, and advanced academic research institutions, the country provides fertile ground for both demand and supply of outsourcing services. States like California, Massachusetts, and North Carolina are hubs for biotech innovation, supported by world-class universities and active venture capital communities.
The presence of a well-established regulatory framework, notably the FDA, makes regulatory affairs services particularly critical. Companies are increasingly choosing to work with local outsourcing partners who understand U.S. compliance standards and can liaise effectively with government agencies. Moreover, as digital health, precision medicine, and personalized therapies gain traction, there is a growing need for niche consulting and auditing services that address both clinical and regulatory intricacies.
Government support through initiatives like Operation Warp Speed and increased funding for biomedical research under the NIH and BARDA have further catalyzed outsourcing in recent years. These programs create additional opportunities for service providers to contribute to public-private partnerships, pandemic preparedness, and innovative healthcare delivery models.
March 2025: Parexel opened a new clinical trial coordination center in North Carolina aimed at supporting decentralized trials and remote patient monitoring services.
January 2025: ICON plc acquired a U.S.-based biotech consulting firm focused on cell and gene therapy regulatory submissions, strengthening its position in high-growth therapeutic areas.
October 2024: Syneos Health entered a strategic collaboration with a leading AI company to integrate predictive analytics into clinical development services, enhancing recruitment and retention efficiency.
August 2024: IQVIA launched an expanded quality management systems consulting service tailored for mid-sized pharma companies seeking FDA approval for novel therapies.
May 2024: Charles River Laboratories partnered with a Boston-based biotech incubator to provide end-to-end product development and auditing services for startups in the oncology space.
This report forecasts revenue growth at country levels and provides an analysis of the latest industry trends in each of the sub-segments from 2021 to 2033. For this study, Nova one advisor, Inc. has segmented the U.S. biotechnology and pharmaceutical services outsourcing market
End-use
Service