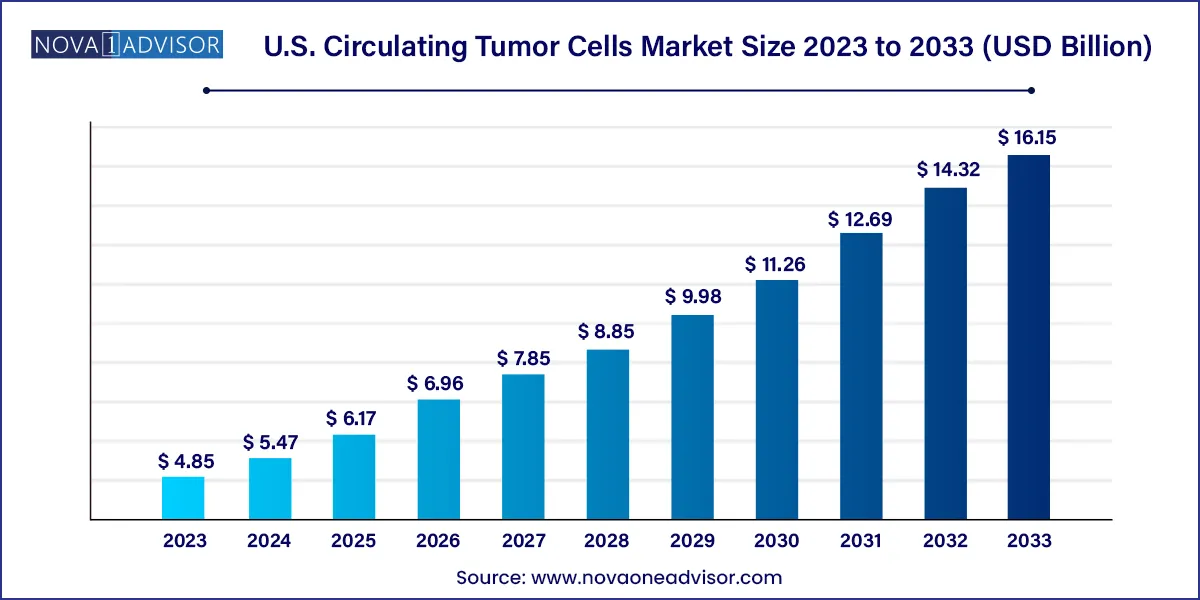
The U.S. circulating tumor cells market size was valued at USD 4.85 billion in 2023 and is projected to surpass around USD 16.15 billion by 2033, registering a CAGR of 12.78% over the forecast period of 2024 to 2033.

The U.S. Circulating Tumor Cells (CTC) market represents one of the most innovative and rapidly expanding sectors within the broader cancer diagnostics and liquid biopsy landscape. Circulating tumor cells are cancer cells that have detached from the primary tumor and entered the bloodstream, offering a non-invasive avenue for understanding tumor biology, disease progression, metastasis potential, and treatment response.
Unlike traditional biopsies that require invasive procedures, CTC detection enables real-time monitoring of cancer dynamics through a simple blood draw. This has significantly altered the clinical approach to cancer detection, staging, and therapeutic decisions. As the field of personalized medicine advances and the demand for minimally invasive diagnostic tools grows, CTCs have emerged as a transformative biomarker for clinicians and researchers alike.
In the U.S., which continues to dominate the global cancer diagnostics market, technological innovation, academic research collaborations, and increasing regulatory support have fueled rapid adoption of CTC technologies. Numerous hospitals, cancer research institutes, and biotech firms across the country have invested in developing advanced CTC platforms that enhance sensitivity, specificity, and throughput.
The utility of CTCs spans both clinical and research settings. Clinically, CTCs support early cancer detection, treatment stratification, and monitoring residual disease or recurrence. In research, they enable insights into tumor heterogeneity, drug resistance, and metastatic pathways. Additionally, advancements in single-cell sequencing, microfluidics, and immuno-enrichment are further expanding the CTC market scope.
The U.S. CTC market is still considered an emerging frontier, with significant potential for growth as new applications in immuno-oncology, cell-free DNA analysis, and multi-omics integration are explored. With rising cancer prevalence, increased awareness of precision diagnostics, and a proactive regulatory environment, the future of CTCs in the U.S. appears both promising and disruptive.
Rise of Liquid Biopsy as a Clinical Standard: CTC-based diagnostics are becoming integral to liquid biopsy panels used in clinical oncology for early detection, prognosis, and therapy monitoring.
Integration with AI and Machine Learning: AI-powered image analysis and pattern recognition are being used for improved identification and classification of CTCs in blood samples.
Microfluidics and Nanotechnology: Enhanced isolation and enrichment techniques using lab-on-a-chip and nanomaterials are gaining popularity due to higher precision and throughput.
Targeted Therapy Monitoring through CTCs: CTC characterization is being increasingly used to guide targeted treatment strategies and assess drug resistance.
Increased Use of CTCs in Immuno-oncology: Immunophenotyping of CTCs is supporting immune response analysis and patient stratification for checkpoint inhibitor therapies.
Multi-omics CTC Profiling: Integration of genomic, transcriptomic, and proteomic data from single CTCs is becoming a trend in cancer systems biology.
Expansion into Early Cancer Screening: Efforts are underway to validate CTC-based tests for population-level screening, especially for cancers with no reliable early markers.
Commercialization of Turnkey Systems: Vendors are introducing ready-to-use CTC isolation and analysis systems to reduce workflow complexity and turnaround time.
Collaborative Research Ecosystem: Partnerships between biotech startups, academic centers, and pharma companies are accelerating CTC-based assay development.
Regulatory Encouragement for Non-invasive Diagnostics: The FDA’s Breakthrough Device designation for several liquid biopsy tests is paving the way for CTC platform approvals.
| Report Attribute | Details |
| Market Size in 2024 | USD 5.47 Billion |
| Market Size by 2033 | USD 16.15 Billion |
| Growth Rate From 2024 to 2033 | CAGR of 12.78% |
| Base Year | 2023 |
| Forecast Period | 2024 to 2033 |
| Segments Covered | Technology, application, product, specimen |
| Market Analysis (Terms Used) | Value (US$ Million/Billion) or (Volume/Units) |
| Report Coverage | Revenue forecast, company ranking, competitive landscape, growth factors, and trends |
| Key Companies Profiled | QIAGEN; Bio-Techne Corp.; Precision for Medicine; AVIVA Biosciences; BIOCEPT, Inc.; BioCEP Ltd.; Fluxion Biosciences, Inc.; Greiner Bio-One International GmbH; Ikonisys, Inc.; Miltenyi Biotec; IVDiagnostics; BioFluidica; Canopus Bioscience Ltd.; Biolidics Limited; Creativ MicroTech, Inc.; LungLife AI, Inc.; Epic Sciences; Rarecells Diagnostics; ScreenCell; Menarini Silicon Biosystems; LineaRx, Inc. (Vitatex, Inc.); Sysmex Corporation; STEMCELL Technologies, Inc. |
One of the most significant drivers in the U.S. CTC market is the increasing demand for non-invasive, repeatable cancer diagnostic tools. Traditional biopsies, though clinically informative, carry risks such as infection, patient discomfort, and procedural limitations in hard-to-reach tumor sites. CTC analysis via liquid biopsy addresses these limitations by offering a safe, blood-based method for detecting and tracking cancer in real time.
The American Cancer Society reports nearly 2 million new cancer cases annually in the U.S., many of which require ongoing diagnostic monitoring during treatment. In this context, CTCs provide vital insights into disease progression, therapeutic response, and resistance patterns. For example, in metastatic breast and prostate cancers, CTC enumeration and phenotyping have shown prognostic relevance, enabling clinicians to tailor therapy decisions based on real-time cellular changes.
Furthermore, the capability to obtain longitudinal molecular data through serial blood draws without repeated invasive procedures makes CTC diagnostics highly desirable in both outpatient and research settings.
Despite significant advances, the U.S. CTC market is constrained by technical complexities and the absence of standardized clinical protocols. The heterogeneity of circulating tumor cells, their extremely low abundance (1–10 CTCs per billion blood cells), and their morphological similarities to leukocytes present challenges in achieving high detection sensitivity and specificity.
Multiple CTC enrichment and detection methods ranging from immunocapture to size-based microfluidics are in use across laboratories, but there is no universal benchmark or FDA-approved standard method for clinical application. This lack of methodological consistency makes it difficult to compare results across platforms, studies, or patient populations, ultimately impeding regulatory approval and clinical adoption.
Moreover, cost and training requirements for operating complex systems limit their accessibility to community hospitals and small labs, keeping much of the market concentrated in academic or high-budget research environments.
A compelling opportunity lies in the expansion of CTC technologies to support immunotherapy selection and monitoring, especially as immune checkpoint inhibitors gain broader indications. By analyzing the immune profile of CTCs such as PD-L1 expression or MHC molecule presentation clinicians can potentially predict a patient’s responsiveness to therapies like pembrolizumab or nivolumab.
Additionally, in precision oncology, molecular profiling of individual CTCs is offering insights into tumor heterogeneity, clonal evolution, and emergence of resistance mutations. Integrating CTC data with circulating tumor DNA (ctDNA), exosomes, and other biomarkers will provide a more holistic understanding of the tumor environment.
As targeted therapy and immunotherapy become more mainstream in oncology, CTCs have the potential to become indispensable tools for treatment selection, patient stratification, and real-time disease monitoring paving the way for broader commercialization and insurance coverage in the U.S.
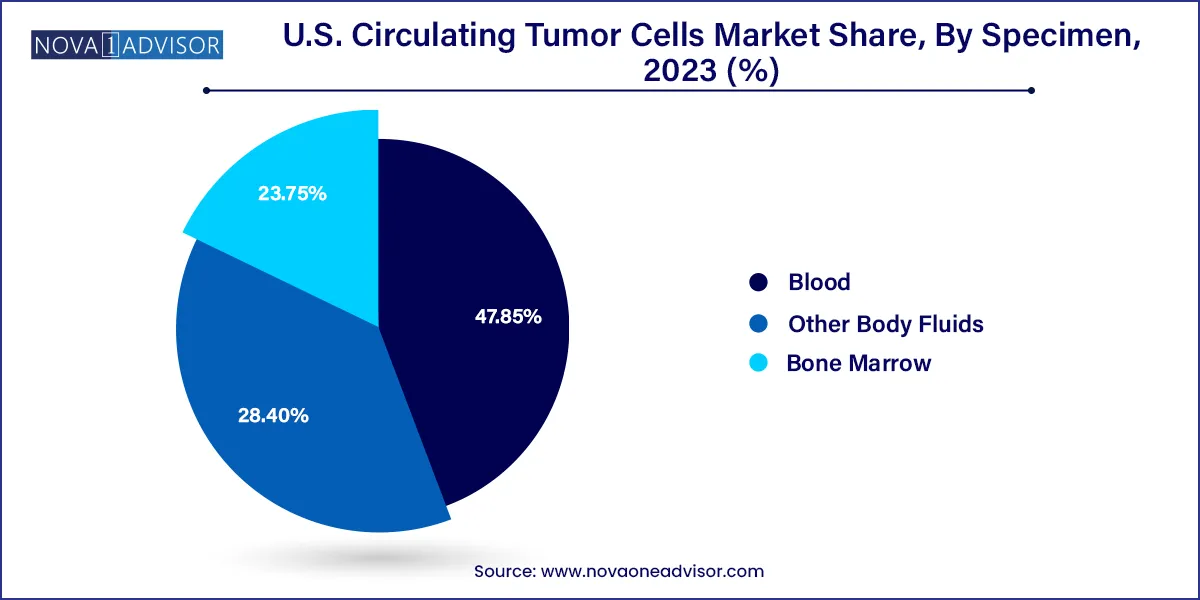
Blood remains the dominant specimen type, as it is the most convenient and least invasive sample for CTC analysis. Most FDA-cleared and CE-marked CTC detection platforms are optimized for peripheral blood samples, making this the gold standard in both clinical and research applications. Blood-based CTC assays are particularly useful for longitudinal studies and repeated patient monitoring over the course of treatment.

Bone marrow is the fastest-growing specimen type, especially in hematologic malignancies and early-stage research into bone metastasis. Several studies have shown that CTCs in the bone marrow niche offer distinct insights into dormancy and micrometastasis. Although still limited to research settings, this specimen type is gaining traction as researchers seek to better understand tumor progression beyond peripheral blood circulation.
CTC Detection & Enrichment Methods dominate the market, as isolation of viable, high-quality CTCs remains the critical first step in downstream analysis. Among these, immunocapture-based technologies—particularly positive selection using epithelial markers like EpCAM—are widely used in both commercial and academic settings. The CellSearch system, which utilizes this principle, is currently the only FDA-cleared platform for CTC enumeration in metastatic breast, prostate, and colorectal cancer. These methods offer high specificity and are commonly used in ongoing clinical trials.
Microfluidic-based separation technologies are the fastest-growing, fueled by advancements in lab-on-a-chip platforms that offer label-free, high-throughput CTC enrichment. Startups like Clearbridge BioMedics and BioFluidica are pioneering devices that utilize size, deformability, and dielectric properties for capturing CTCs without introducing bias from antigen expression. The increased adoption of microfluidics is expected to reduce operational complexity, cost, and sample processing time, enabling broader use in decentralized testing environments.
Clinical/Liquid Biopsy applications lead the U.S. market, driven by growing clinical validation for CTCs in patient stratification, early detection, and monitoring treatment efficacy. Risk assessment and screening are increasingly supported by CTC tests in patients with suspected cancer or high-risk genetic backgrounds. Monitoring applications dominate within this segment, especially in metastatic cancers, where serial CTC enumeration informs changes in therapeutic strategy.
Research applications are the fastest-growing segment, particularly in cancer stem cell (CSC) studies and drug development. Scientists are increasingly using isolated CTCs to establish in vitro tumor models and study tumorogenesis, epithelial-mesenchymal transition (EMT), and resistance mechanisms. Additionally, pharmaceutical companies are integrating CTC assays into early-phase clinical trials to validate companion diagnostics and evaluate pharmacodynamics.
Devices or systems currently dominate, encompassing a wide range of platforms for CTC enrichment, detection, and imaging. These include integrated platforms that perform immunostaining, imaging cytometry, and even genomic analysis. Institutions investing in high-throughput screening and personalized medicine programs prefer turnkey systems that offer automation and integration with laboratory information systems.
Kits and reagents are the fastest-growing segment, reflecting the growing need for flexible, scalable CTC workflows. Researchers often use customizable kits for immunostaining, RNA extraction, or mutation analysis following CTC capture. As labs increasingly perform in-house protocol development and customization, reagent demand is expected to soar. Additionally, reagent rental and subscription models are making these consumables more accessible to smaller labs and startups.
The United States represents the largest and most advanced market for circulating tumor cell technologies, driven by high cancer incidence, strong reimbursement frameworks, and a mature biotech ecosystem. Government agencies like the National Cancer Institute (NCI) and private organizations including the American Cancer Society have actively supported CTC research through grant funding and public awareness campaigns.
Leading academic centers such as MD Anderson Cancer Center, Memorial Sloan Kettering, and the Dana-Farber Cancer Institute are routinely integrating CTC assays into clinical trial protocols. Many of these institutions partner with diagnostic and pharma companies to explore the utility of CTCs in new therapeutic areas, including rare and pediatric cancers.
Additionally, the FDA has demonstrated openness to novel liquid biopsy platforms, having granted Breakthrough Device status to several related technologies. This regulatory encouragement is fostering innovation and commercial partnerships. The U.S. also houses the headquarters or regional offices of most major players in the CTC ecosystem, further cementing its leadership in the global market.
March 2025: Menarini Silicon Biosystems announced the launch of CELLSEARCH® NEXTGEN, an enhanced version of its FDA-approved CTC detection platform with expanded biomarker compatibility for clinical research.
February 2025: Epic Sciences collaborated with a major U.S. academic center to initiate a study using its no-cell-loss CTC detection platform in metastatic prostate cancer patients.
January 2025: BioFluidica raised $25 million in Series C funding to commercialize its microfluidics-based CTC isolation platform for decentralized oncology diagnostics.
December 2024: ANGLE plc received positive interim results from a U.S.-based clinical study evaluating its Parsortix® system for monitoring ovarian cancer treatment.
November 2024: RareCyte Inc. expanded its Seattle headquarters and announced the release of a new reagent kit enabling single-cell RNA sequencing directly from isolated CTCs.
This report forecasts revenue growth at country levels and provides an analysis of the latest industry trends in each of the sub-segments from 2021 to 2033. For this study, Nova one advisor, Inc. has segmented the U.S. Circulating Tumor Cells market.
By Technology
By Application
By Product
By Specimen