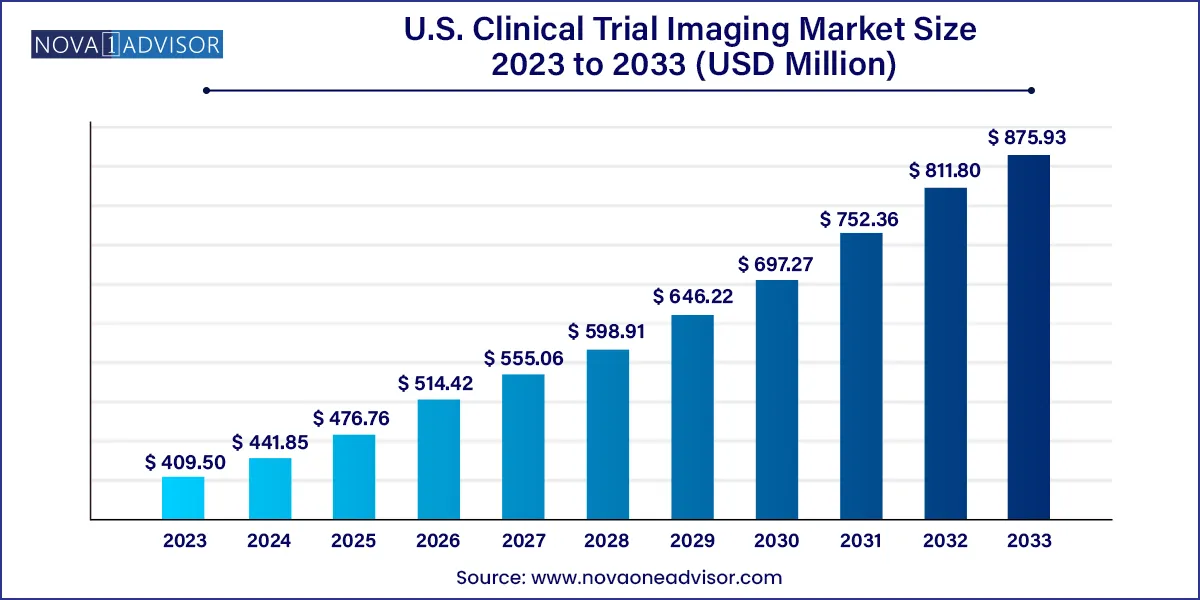
The U.S. clinical trial imaging market size was valued at USD 409.50 million in 2023 and is projected to surpass around USD 875.93 million by 2033, registering a CAGR of 7.9% over the forecast period of 2024 to 2033.

The U.S. Clinical Trial Imaging Market plays a pivotal role in the drug development and medical device evaluation processes by offering advanced imaging technologies to assess the efficacy, safety, and pharmacodynamics of investigational therapies. The use of medical imaging in clinical trials enables researchers and sponsors to extract quantifiable biomarkers, visualize disease progression or regression, and ensure high-quality data interpretation. These services, which span modalities such as MRI, CT, and ultrasound, enhance decision-making in early and late-phase clinical trials and increase the likelihood of regulatory success.
With the U.S. being the epicenter of global clinical research activities home to leading pharmaceutical giants, biotech startups, and contract research organizations (CROs) the demand for integrated imaging solutions in clinical trials is growing exponentially. Technological innovations like artificial intelligence (AI) integration in image processing, remote imaging capabilities, and cloud-based image sharing platforms are further elevating the scope and complexity of imaging within the clinical trial ecosystem.
The importance of imaging in therapeutic areas such as oncology, musculoskeletal, and ophthalmology is particularly noteworthy, where visual proof of efficacy significantly influences trial outcomes. As of 2024, the U.S. market is experiencing an upsurge in the outsourcing of imaging services, supported by increasing trial complexity and rising investment in targeted therapies. Regulatory agencies like the FDA are also encouraging standardized imaging protocols, fueling quality and consistency across multi-site trials.
AI-Powered Image Analysis: The integration of AI and machine learning in imaging analytics is reducing interpretation time, improving accuracy, and supporting adaptive clinical trial designs.
Decentralized Clinical Trials (DCTs): Imaging service providers are now tailoring their offerings to suit remote trial models by enabling mobile imaging and cloud-based image uploads.
Increased Focus on Oncology Trials: The oncology segment is the dominant application area for clinical trial imaging due to the reliance on radiographic endpoints and tumor response evaluations.
Strategic Collaborations: Key players are forming alliances with CROs and imaging tech providers to offer end-to-end services and expand trial capabilities.
Growing Use of Centralized Imaging Review: Central reading and analytics are being increasingly adopted to ensure consistency and minimize variability in imaging assessments.
Adoption of Imaging Biomarkers: Clinical researchers are embracing imaging biomarkers to gain early insights into drug efficacy, especially in CNS and cardiovascular studies.
Data Standardization and Compliance: Growing regulatory requirements are encouraging companies to adopt platforms that support compliance with CDISC, DICOM, and FDA standards.
| Report Attribute | Details |
| Market Size in 2024 | USD 441.85 million |
| Market Size by 2033 | USD 875.93 million |
| Growth Rate From 2024 to 2033 | CAGR of 7.9% |
| Base Year | 2023 |
| Forecast Period | 2024 to 2033 |
| Segments Covered | Service, modality, application, end-use |
| Market Analysis (Terms Used) | Value (US$ Million/Billion) or (Volume/Units) |
| Report Coverage | Revenue forecast, company ranking, competitive landscape, growth factors, and trends |
| Key Companies Profiled | IXICO plc; Navitas Life Sciences; Resonance Health; ProScan Imaging; Radiant Sage LLC; Medpace; Biomedical Systems Corp; Cardiovascular Imaging Technologies; Intrinsic Imaging; BioTelemetry |
One of the primary drivers of the U.S. Clinical Trial Imaging Market is the growing complexity of clinical trials, especially in therapeutic areas like oncology, neurology, and cardiology. These trials demand precise, quantifiable endpoints that imaging technologies can deliver. With more personalized medicine approaches being pursued, imaging biomarkers are becoming integral in both patient stratification and outcome assessment. For instance, oncology trials often use RECIST (Response Evaluation Criteria In Solid Tumors) guidelines, which are heavily reliant on CT and MRI scans for tumor measurements.
Moreover, the FDA and other regulatory bodies emphasize data transparency and traceability, which advanced imaging platforms can facilitate through structured data capture and standardized reporting. This has led to increasing demand for end-to-end imaging services from image acquisition to central reading and reporting which can manage the intricate demands of modern trials. The rise of adaptive trials, where real-time decisions are made based on interim results, also underscores the need for fast, reliable imaging analytics that only specialized providers can offer.
Despite the benefits, the high cost associated with clinical trial imaging poses a significant restraint. Imaging services can account for a substantial proportion of a trial’s budget, particularly in studies that require frequent scans or multiple imaging modalities. Small- to mid-sized biotech companies, which form a large part of the innovation pipeline, often find it challenging to afford sophisticated imaging protocols, especially those involving advanced MRI or PET technologies.
Additionally, regulatory compliance, data security, and centralized review requirements further add to operational expenses. The cost of setting up and maintaining secure, cloud-based imaging platforms, training site personnel, and ensuring standardization across multi-center trials is considerable. These financial burdens often deter smaller players from fully leveraging imaging technologies, which in turn could impact the quality of data collected during trials.
While oncology dominates the use of imaging in clinical trials, the increasing utilization of imaging in non-oncology areas—such as NASH (non-alcoholic steatohepatitis), CKD (chronic kidney disease), and musculoskeletal disorders—presents a significant growth opportunity. Diseases like NASH require liver fat quantification and fibrosis staging, which can be accurately assessed using MRI-PDFF (proton density fat fraction) and elastography, respectively.
Similarly, musculoskeletal imaging, including ultrasound and MRI, is critical in assessing cartilage degradation in osteoarthritis trials. The FDA's growing openness to surrogate imaging biomarkers in non-oncology indications allows for earlier and more confident decision-making in these trials. Companies that can tailor their services to cater to these expanding indications are poised to gain a competitive advantage. With the U.S. seeing a rise in metabolic disorders and an aging population, the demand for advanced imaging in these new therapeutic frontiers is likely to grow significantly.
Reading and Analytical Services dominated the service segment in the U.S. Clinical Trial Imaging Market due to their critical role in ensuring standardized image interpretation across study sites. Central reading provides a uniform and unbiased evaluation of trial data, minimizing inter-reader variability—a key concern in trials where imaging is the primary endpoint. These services support regulatory submissions and are essential for generating reproducible and defensible results. Imaging core labs offering advanced analytics and integrated platforms are in high demand, particularly for oncology, CNS, and ophthalmology trials.
System and Technology Support Services are the fastest-growing sub-segment, driven by the increasing complexity of clinical trial infrastructure and the shift towards digitization. These services encompass imaging software solutions, secure data sharing platforms, integration with electronic data capture (EDC) systems, and compliance tools. As trials move toward decentralization, demand for seamless technology support to enable remote imaging, AI-powered diagnostics, and real-time data uploads is surging.
Magnetic Resonance Imaging (MRI) emerged as the dominant modality, largely because of its non-invasive nature and superior soft-tissue contrast. MRI is the gold standard in neurology and musculoskeletal studies and plays a crucial role in evaluating complex endpoints like brain volume changes or joint inflammation. It’s also widely used in oncology to assess treatment response. The modality’s versatility and ability to generate high-resolution, multi-parametric images make it indispensable in both early- and late-phase trials.
Optical Coherence Tomography (OCT) is the fastest-growing modality, particularly in ophthalmology clinical trials. OCT provides micrometer-resolution imaging of the retina and is vital for tracking disease progression in conditions like age-related macular degeneration (AMD) and diabetic retinopathy. Its non-invasive nature, fast imaging time, and suitability for longitudinal studies make it a preferred choice in eye-related trials, which are increasing due to a rising prevalence of chronic eye conditions in the U.S.
Oncology dominated the application segment owing to the indispensable role of imaging in cancer diagnosis, staging, and response evaluation. Clinical trials for oncology heavily rely on imaging endpoints to measure tumor size, metastasis, and progression-free survival. Modalities like CT, MRI, and PET scans are routinely employed in these trials. The high volume of ongoing oncology trials in the U.S., supported by accelerated drug approval pathways and a surge in immunotherapy research, further strengthens the segment’s dominance.
NASH (Non-alcoholic Steatohepatitis) is the fastest-growing application segment, driven by increasing awareness and FDA guidance supporting imaging biomarkers for non-invasive assessment of liver fat and fibrosis. As liver biopsy the traditional diagnostic method has limitations in repeatability and patient compliance, imaging has become the preferred method in NASH trials. MRI-PDFF and MR elastography are now routinely used in trials to assess efficacy and stage disease, enabling better recruitment and longitudinal tracking.
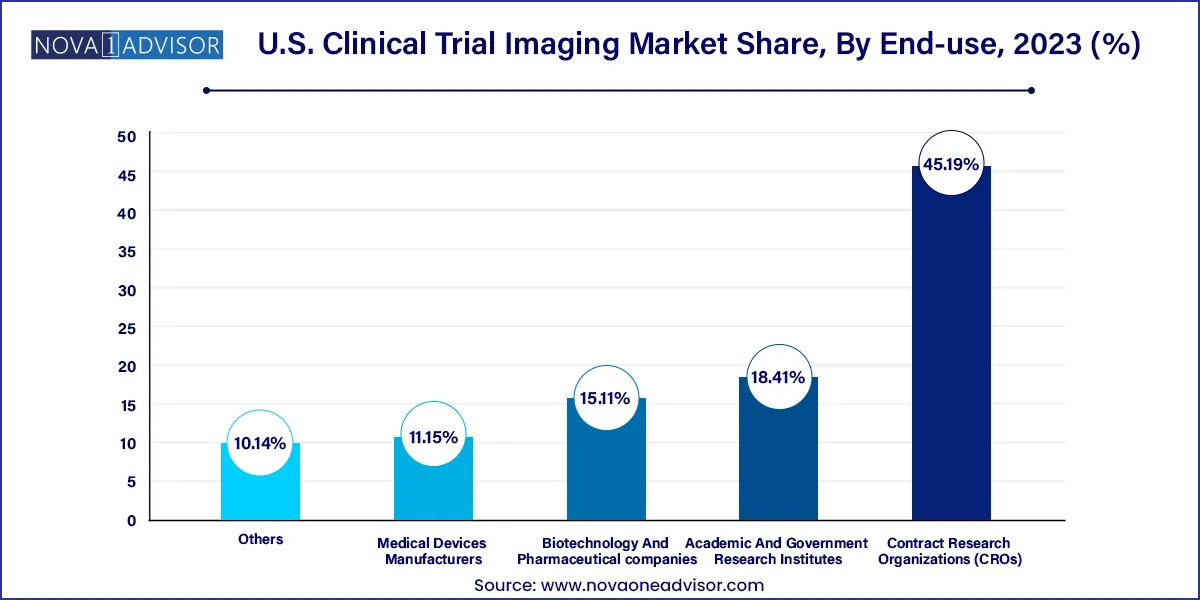
Biotechnology and Pharmaceutical Companies are the leading end-users, accounting for the largest share of the market. These companies are at the forefront of drug development and require comprehensive imaging solutions to streamline trial workflows, support FDA submissions, and accelerate time-to-market. With numerous new molecules in the pipeline, the demand for outsourced imaging expertise and centralized analytics has surged among sponsors.

Contract Research Organizations (CROs) are witnessing the fastest growth, primarily due to the increasing trend of outsourcing clinical trial operations. CROs offer scalable solutions and possess the technical infrastructure to manage complex imaging protocols. Their integrated services from patient recruitment to image interpretation make them a cost-effective alternative, especially for small and mid-sized pharma and biotech firms looking to minimize overheads.
The United States leads the global clinical trial landscape, and imaging plays a central role in this leadership. According to the U.S. National Library of Medicine’s ClinicalTrials.gov database, over 40% of the world’s registered clinical trials are conducted in the U.S. The country boasts a robust healthcare infrastructure, a well-defined regulatory framework, and a dense concentration of pharmaceutical and biotechnology companies. These factors collectively contribute to the burgeoning demand for high-quality clinical trial imaging services.
In recent years, government initiatives such as the Cancer Moonshot program and the NIH's increased funding for chronic disease research have expanded imaging applications across new therapeutic areas. Major urban hubs like Boston, San Diego, and Philadelphia continue to serve as biotech clusters with high imaging trial activity. Furthermore, the growing adoption of AI-driven image analysis tools and cloud-based platforms in U.S. trials signifies a move towards higher efficiency and data-driven decision-making.
In January 2025, ICON plc announced a strategic partnership with a U.S.-based imaging technology firm to enhance AI-driven image analysis for oncology trials, aiming to reduce turnaround time by 30%.
In October 2024, Medpace Holdings, Inc. launched a new imaging core lab facility in Cincinnati, Ohio, dedicated to cardiovascular and musculoskeletal trials.
In August 2024, Parexel International unveiled a new digital platform in collaboration with a cloud imaging startup to support decentralized clinical trials with remote imaging capabilities.
In June 2024, Bioclinica (now part of Clario) received FDA clearance for its AI-based imaging software intended to assist with liver fat quantification in NASH clinical trials.
The key U.S. clinical trial imaging companies include ProScan Imaging, IXICO plc, and Biomedical Systems Corp. Numerous market players are expanding their global footprint by establishing collaborations, partnerships, and acquisitions to tap into new markets and countries. Collaborations with healthcare providers and research institutions, such as the Mayo Clinic and academic medical centers, are opportunistic to access expertise and assess their technologies in real-world clinical settings.
This report forecasts revenue growth at country levels and provides an analysis of the latest industry trends in each of the sub-segments from 2021 to 2033. For this study, Nova one advisor, Inc. has segmented the U.S. Clinical Trial Imaging market.
By Service
By Modality
By Application
By End-use