U.S. Non-destructive Testing Market Size, Share & Trends Analysis Report By Test Method (Traditional NDT Method, Digital/Advanced NDT Method), By Offering (Services, Equipment), By Vertical,- Industry Analysis, Size, Share, Growth, Trends, and Forecast 2024-2033

U.S. Non-destructive Testing Market Size and Trends

The U.S. non-destructive testing market size was exhibited at USD 5.75 billion in 2023 and is projected to hit around USD 14.12 billion by 2033, growing at a CAGR of 9.4% during the forecast period 2024 to 2033.
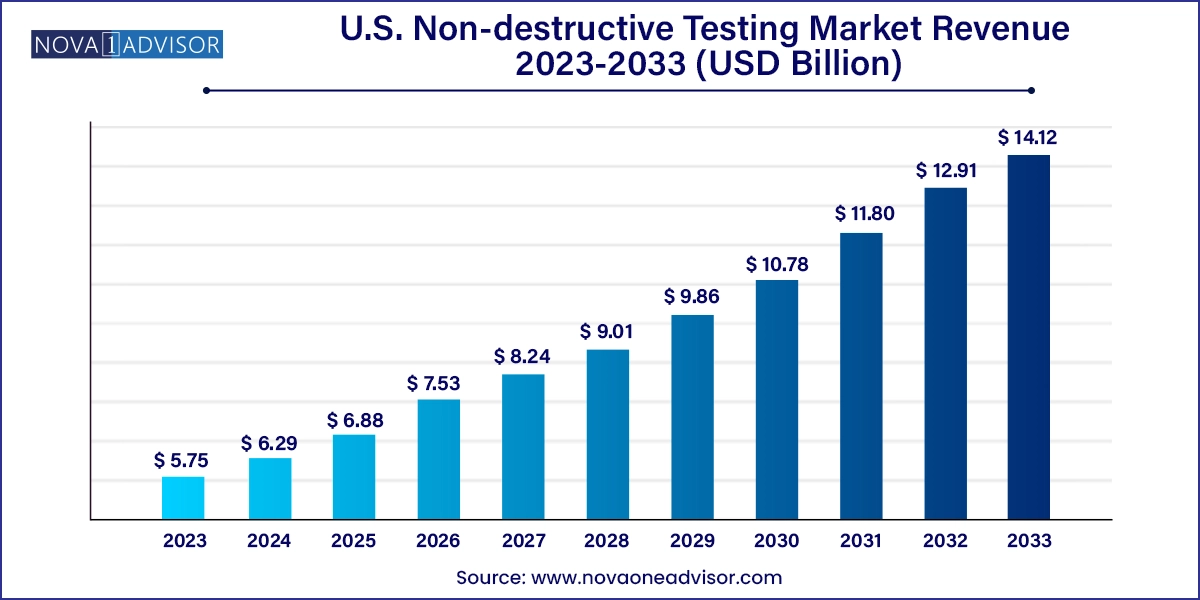
U.S. Non-destructive Testing Market Size 2024 To 2033

U.S. Non-destructive Testing Market Key Takeaways:

  • The services segment dominated the market with the largest revenue share of 77.1% in 2023
  • The traditional test method segment dominated the U.S. market with the largest revenue share of 80.0% in 2023.
  • The manufacturing vertical segment dominated the market with the largest revenue share of 21.6% in 2022.

Report Scope of U.S. Non-destructive Testing Market

 Report Coverage  Details
Market Size in 2024 USD 6.29 Billion
Market Size by 2033 USD 14.12 Billion
Growth Rate From 2024 to 2033 CAGR of 9.4%
Base Year 2023
Forecast Period 2024-2033
Segments Covered Offering, Test Method, Vertical
Market Analysis (Terms Used) Value (US$ Million/Billion) or (Volume/Units)
Country scope U.S.
Key Companies Profiled Bureau Veritas; Fischer Technologies Inc.; MISTRAS Group, Inc.; Comet Group (YXLON International GmbH); MME Group; TWI Ltd; Nikon Metrology Inc.; Olympus Corporation; Sonatest; Zetec Inc.

The increasing technological developments in advanced non-destructive testing (NDT) processes have resulted in better and more precise safety & fault detection. With the presence of a large manufacturing sector in the U.S. and the increasing awareness among manufacturers regarding the adoption of NDT techniques, the U.S. market is anticipated to witness growth in the coming years.

The implementation of NDT techniques in projects saves time and resources due to the detection of faults in complex areas and irregular surfaces, which results in the early completion of projects. This detection and reduction in failures is projected to fuel the demand for non-destructive testing in the coming years. In addition, the ease of operating and efficiency in fault detection provided by ultrasonic equipment, compared to other NDT equipment, is a significant factor contributing to the increasing adoption of the ultrasonic test method. Moreover, advancements in ultrasonic technology anticipated within the next seven years are likely to further boost the adoption of this testing procedure due to its simplicity.

The market is projected to experience significant growth during the forecast period. This growth can be attributed to the increasing construction and manufacturing projects in the U.S. The fast pace of such projects necessitates the implementation of testing processes to ensure the quality of work. This trend is expected to have a positive impact on the growth of NDT in the U.S. market.

Increasing oil and gas projects in the U.S. are expected to deploy NDT techniques to complete the projects in prescribed timelines and with finesse, thus fueling the demand for NDT equipment in the U.S. In addition, the advancements in non-destructive testing technology have led to the development of radiographic testing equipment such as industrial CT scanners, which precisely detect faults in machinery and components. However, the cost of the NDT equipment and the expertise required to perform the tests increases the complexity and difficulty of deploying the radiographic testing method.

U.S. Non-destructive Testing Market By Offering Insights

The services segment dominated the market with the largest revenue share of 77.1% in 2023 and is expected to remain dominant over the forecast period. Due to the significant upfront cost associated with non-destructive equipment as well as the technicalities involved in deployment and installation, most of the end-users outsource their NDT operations. Furthermore, stringent government regulations pertaining to workplace safety further encourage end-users to outsource their NDT operations to third-party service providers.

The equipment segment is anticipated to witness a steady CAGR from 2024 to 2033. This growth is mainly due to technological advancements, which have resulted in the availability of state-of-the-art equipment variants. The availability of these advanced equipment variants has broadened the range of applications for NDT equipment, thereby generating additional demand.

U.S. Non-destructive Testing Market By Test Method Insights

The traditional test method segment dominated the U.S. market with the largest revenue share of 80.0% in 2023. This market growth is due to increasing adoption of traditional non-destructive testing (NDT) methods, including visual testing, magnetic particle testing, liquid penetrant testing, eddy current testing, ultrasonic testing, and radiographic testing. The ultrasonic testing sub-segment dominates the market due to its portability, easy usability, and better accuracy compared to other traditional NDT techniques. The adoption of ultrasonic testing is experiencing significant growth and is expected to dominate in the forthcoming years.
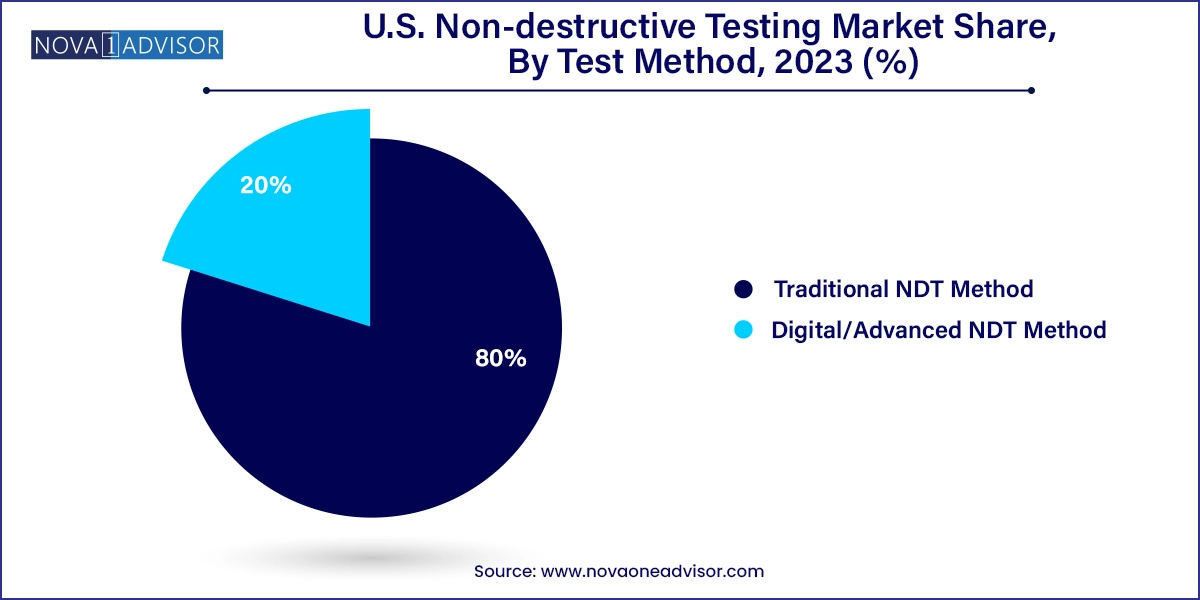
U.S. Non-destructive Testing Market Share, By Test Method, 2023 (%)

Within the ultrasonic testing segment, phased array ultrasonic testing (PAUT) has emerged as the dominant segment with the largest revenue share of 22.6% in 2023. With the detailed visualization feature offered by the PAUT, which enables the identification of defect size, depth, shape, and orientation, PAUT is the most preferred method and is considered an advanced version of ultrasonic testing as it employs multiple transducers and sets of ultrasonic testing (UT) probes comprised of numerous smaller elements.

U.S. Non-destructive Testing Market By Vertical Insights

The manufacturing vertical segment dominated the market with the largest revenue share of 21.6% in 2022. This growth is a result of the increasing volume of the manufacturing sector in the U.S. The manufacturing vertical is expected to deploy numerous NDT processes thereby leading to an increase in demand for non-destructive testing services in the U.S. Moreover, non-destructive testing has been traditionally used extensively in oil and gas applications. Test methods such as ultrasonic and eddy current have been used to detect cracks in the pipes both underground and elevated. However, with increasing awareness, non-destructive testing techniques are being deployed in several other applications such as aerospace, defense, and automotive.

The oil & gas vertical is further sub-segmented into upstream, midstream, & downstream. The downstream activities in the oil & gas industry include refining petroleum products to produce end products, such as gasoline and kerosene. Refineries and petrochemical plants work with large volumes of oil flowing through tubing, pressure vessels, storage tanks, and pipes. Hence, downstream oil & gas companies particularly need to ensure the safety of the environment, workers, and the facility by ensuring the integrity of equipment and spot welding.

U.S. Non-destructive Testing Market Recent Developments

  • Nikon: Nikon IMBU has launched three new models in its VOXLS range of X-ray CT (computed tomography) systems for non-destructive inspection. The 30 Series specifically addresses the need in the industry for an automation-ready system to meet a wide range of industrial applications.

  • Sonatest: Sonatest announced the launch of WheelProbe2 128 Elements (WP2 E128). This addition to the WheelProbe products is built upon the success of its predecessor, the WP2, and redefines the boundaries of scan mapping capabilities for large-scale inspectio

Some of the prominent players in the U.S. non-destructive testing market include:

  • Bureau Veritas
  • Fischer Technologies Inc.
  • Mistras Group, Inc
  • Comet Group (YXLON International GmbH)
  • MME Group
  • TWI Ltd
  • Nikon Metrology Inc.
  • Olympus Corporation
  • Sonatest
  • Zetec Inc.

Segments Covered in the Report

This report forecasts revenue growth at country levels and provides an analysis of the latest industry trends in each of the sub-segments from 2021 to 2033. For this study, Nova one advisor, Inc. has segmented the U.S. non-destructive testing market

Offering

  • Services
  • Equipment

Test Method

  • Traditional NDT Method
    • Visual Testing
    • Magnetic Particle Testing
    • Liquid Penetrant Testing
    • Eddy Current Testing
    • Ultrasonic Testing
    • Radiographic Testing
  • Digital/Advanced NDT Method
    • Digital Radiography (DR)
    • Phased Array Ultrasonic Testing (PAUT)
    • Pulsed Eddy Current (PEC)
    • Time-Of-Flight Diffraction (TOFD)
    • Alternating Current Field Measurement (ACFM)
    • Automated Ultrasonic Testing (AUT)

Vertical

  • Oil & Gas
    • Upstream
    • Midstream
    • Downstream
  • Manufacturing
  • Aerospace and Defense
  • Construction
  • Automotive
  • Power Generation
  • Others

Frequently Asked Questions

The U.S. non-destructive testing market size was exhibited at USD 5.75 billion in 2023 and is projected to hit around USD 14.12 billion by 2033, growing at a CAGR of 9.4% during the forecast period 2024 to 2033.

The U.S. non-destructive testing market is expected to grow at a compound annual growth rate of 9.4% from 2024 to 2033 to reach USD 14.12 billion by 2033.

Services dominated the U.S. non-destructive testing market with a share of over 77.0% in 2023. The regulatory requirements and industry standards in the country are driving the growth of NDT services.

Some key players operating in the U.S. non-destructive testing market include Bureau Veritas, Fischer Technologies Inc., Mistras Group, Inc, Comet Group (YXLON International GmbH), MME Group, TWI Ltd, Nikon Metrology Inc., Olympus Corporation, Sonatest, and Zetec Inc.

Key factors driving the market growth include the presence of numerous market players and high manufacturing activities in the country.

Chapter 1. Methodology and Scope

1.1. Market Segmentation and Scope

1.2. Market Definitions

1.3. Research Methodology

1.3.1. Information Procurement

1.3.2. Information or Data Analysis

1.3.3. Market Formulation & Data Visualization

1.3.4. Data Validation & Publishing

1.4. Research Scope and Assumptions

1.4.1. List of Data Sources

Chapter 2. Executive Summary

2.1. Market Outlook

2.2. Segment Outlook

2.3. Competitive Insights

Chapter 3. U.S. Non-Destructive Testing Market Variables, Trends, & Scope

3.1. Market Introduction/Lineage Outlook

3.2. Market Size and Growth Prospects (USD Million)

3.3. Industry Value Chain Analysis

3.4. Market Dynamics

3.4.1. Market Drivers Analysis

3.4.1.1. Technological advancements in NDT

3.4.2. Market Restraints Analysis

3.4.2.1. Increasing complexity of NDT processes

3.4.3. Industry Opportunities

3.4.3.1 Forward integration with the latest technologies

3.4.3.2 Growing significance of advanced NDT techniques in various industrial sectors

3.4.4. Industry Challenges

3.5. U.S. Non-Destructive Testing Market Analysis Tools

3.5.1. Porter’s Analysis

3.5.1.1. Bargaining power of the suppliers

3.5.1.2. Bargaining power of the buyers

3.5.1.3. Threats of substitution

3.5.1.4. Threats from new entrants

3.5.1.5. Competitive rivalry

3.5.2. PESTEL Analysis

3.5.2.1. Political landscape

3.5.2.2. Economic and Social landscape

3.5.2.3. Technological landscape

3.5.2.4. Environmental landscape

3.5.2.5. Legal landscape

Chapter 4. U.S. Non-Destructive Testing Market Offering Estimates & Trend Analysis

4.1. Segment Dashboard

4.2. U.S. Non-Destructive Testing Market: Offering Movement Analysis, 2024 & 2033 (USD Million)

4.3. Services

4.3.1. Services Market Revenue Estimates and Forecasts, 2021 - 2033 (USD Million)

4.4. Equipment

4.4.1. Equipment Market Revenue Estimates and Forecasts, 2021 - 2033 (USD Million)

Chapter 5. U.S. Non-Destructive Testing Market: Test Estimates & Trend Analysis

5.1. Segment Dashboard

5.2. U.S. Non-Destructive Testing Market: Test Method Movement Analysis, 2024 & 2033 (USD Million)

5.3. Traditional NDT Method

5.3.1. Traditional NDT Method Market Revenue Estimates and Forecasts, 2021 - 2033 (USD Million)

5.3.1.1. Visual Testing

5.3.1.1.1. Visual Testing Market Revenue Estimates and Forecasts, 2021 - 2033 (USD Million)

5.3.1.2. Magnetic Particle Testing

5.3.1.2.1. Magnetic Particle Testing Market Revenue Estimates and Forecasts, 2021 - 2033 (USD Million)

5.3.1.3. Liquid Penetrant Testing

5.3.1.3.1. Liquid Penetrant Testing Market Revenue Estimates and Forecasts, 2021 - 2033 (USD Million)

5.3.1.4. Eddy Current Testing

5.3.1.4.1. Eddy Current Testing Lighting Market Revenue Estimates and Forecasts, 2021 - 2033 (USD Million)

5.3.1.5. Ultrasonic Testing

5.3.1.5.1. Ultrasonic Testing Market Revenue Estimates and Forecasts, 2021 - 2033 (USD Million)

5.3.1.6. Radiographic Testing

5.3.1.6.1. Radiographic Testing Market Revenue Estimates and Forecasts, 2021 - 2033 (USD Million)

5.4. Digital/Advanced NDT Method

5.4.1. Digital/Advanced NDT Method Market Revenue Estimates and Forecasts, 2021 - 2033 (USD Million)

5.4.1.1. Digital Radiography (DR)

5.4.1.1.1. Digital Radiography (DR) Market Revenue Estimates and Forecasts, 2021 - 2033 (USD Million)

5.4.1.2. Phased Array Ultrasonic Testing (PAUT)

5.4.1.2.1. Phased Array Ultrasonic Testing (PAUT) Market Revenue Estimates and Forecasts, 2021 - 2033 (USD Million)

5.4.1.3. Pulsed Eddy Current (PEC)

5.4.1.3.1. Pulsed Eddy Current (PEC) Market Revenue Estimates and Forecasts, 2021 - 2033 (USD Million)

5.4.1.4. Time-Of-Flight Diffraction (TOFD)

5.4.1.4.1. Time-Of-Flight Diffraction (TOFD) Market Revenue Estimates and Forecasts, 2021 - 2033 (USD Million)

5.4.1.5. Alternating Current Field Measurement (ACFM)

5.4.1.5.1. Alternating Current Field Measurement (ACFM) Market Revenue Estimates and Forecasts, 2021 - 2033 (USD Million)

5.4.1.6. Automated Ultrasonic Testing (AUT)

5.4.1.6.1. Automated Ultrasonic Testing (AUT) Market Revenue Estimates and Forecasts, 2021 - 2033 (USD Million)

Chapter 6. U.S. Non-Destructive Testing Market: Vertical Estimates & Trend Analysis

6.1. Segment Dashboard

6.2. U.S. Non-Destructive Testing Market: Vertical Movement Analysis, 2024 & 2033 (USD Million)

6.2.1. Oli & Gas Market Revenue Estimates and Forecasts, 2021 - 2033 (USD Million)

6.2.1.1. Upstream

6.2.1.2. Upstream Market Revenue Estimates and Forecasts, 2021 - 2033 (USD Million)

6.2.1.3. Midstream

6.2.1.4. Midstream Market Revenue Estimates and Forecasts, 2021 - 2033 (USD Million)

6.2.1.5. Downstream

6.2.1.6. Downstream Market Revenue Estimates and Forecasts, 2021 - 2033 (USD Million)

6.2.2. Manufacturing

6.2.2.1. Manufacturing Automotive Market Revenue Estimates and Forecasts, 2021 - 2033 (USD Million)

6.2.3. Aerospace and Defense

6.2.3.1. Aerospace and Defense Market Revenue Estimates and Forecasts, 2021 - 2033 (USD Million)

6.2.4. Construction

6.2.4.1. Construction Market Revenue Estimates and Forecasts, 2021 - 2033 (USD Million)

6.2.5. Automotive

6.2.5.1. Automotive Market Revenue Estimates and Forecasts, 2021 - 2033 (USD Million)

6.2.6. Power Generation

6.2.6.1. Power Generation Market Revenue Estimates and Forecasts, 2021 - 2033 (USD Million)

6.2.7. Others

6.2.7.1. Others Market Revenue Estimates and Forecasts, 2021 - 2033 (USD Million)

Chapter 7. Competitive Landscape

7.1. Recent Developments & Impact Analysis by Key Market Participants

7.2. Company Categorization

7.3. Company Market Positioning

7.4. Company Market Share Analysis

7.5. Company Heat Map Analysis

7.6. Strategy Mapping

7.6.1. Expansion

7.6.2. Mergers & Acquisition

7.6.3. Partnerships & Collaborations

7.6.4. New Product Launches

7.6.5. Research And Development

7.7. Company Profiles

7.7.1. Bureau Veritas

7.7.1.1. Participant’s Overview

7.7.1.2. Financial Performance

7.7.1.3. Product Benchmarking

7.7.1.4. Recent Developments/ Strategic Initiatives

7.7.2. Fischer Technologies Inc.

7.7.2.1. Participant’s Overview

7.7.2.2. Financial Performance

7.7.2.3. Product Benchmarking

7.7.2.4. Recent Developments/ Strategic Initiatives

7.7.3. Mistras Group, Inc.

7.7.3.1. Participant’s Overview

7.7.3.2. Financial Performance

7.7.3.3. Product Benchmarking

7.7.3.4. Recent Developments/ Strategic Initiatives

7.7.4. Comet Group (YXLON International GmbH)

7.7.4.1. Participant’s Overview

7.7.4.2. Financial Performance

7.7.4.3. Product Benchmarking

7.7.4.4. Recent Developments/ Strategic Initiatives

7.7.5. MME Group

7.7.5.1. Participant’s Overview

7.7.5.2. Financial Performance

7.7.5.3. Product Benchmarking

7.7.5.4. Recent Developments/ Strategic Initiatives

7.7.6. TWI Ltd

7.7.6.1. Participant’s Overview

7.7.6.2. Financial Performance

7.7.6.3. Product Benchmarking

7.7.6.4. Recent Developments/ Strategic Initiatives

7.7.7. Nikon Metrology Inc.

7.7.7.1. Participant’s Overview

7.7.7.2. Financial Performance

7.7.7.3. Product Benchmarking

7.7.7.4. Recent Developments/ Strategic Initiatives

7.7.8. Olympus Corporation

7.7.8.1. Participant’s Overview

7.7.8.2. Financial Performance

7.7.8.3. Product Benchmarking

7.7.8.4. Recent Developments/ Strategic Initiatives

7.7.9. Sonatest

7.7.9.1. Participant’s Overview

7.7.9.2. Financial Performance

7.7.9.3. Product Benchmarking

7.7.9.4. Recent Developments/ Strategic Initiatives

7.7.10. Zetec Inc.

7.7.10.1. Participant’s Overview

7.7.10.2. Financial Performance

7.7.10.3. Product Benchmarking

7.7.10.4. Recent Developments/ Strategic Initiatives

Proceed To Buy

USD 3800
USD 1900
USD 1200

Customization Offered

  • check-img Cross-segment Market Size and Analysis for Mentioned Segments
  • check-imgAdditional Company Profiles (Upto 5 With No Cost)
  • check-img Additional Countries (Apart From Mentioned Countries)
  • check-img Country/Region-specific Report
  • check-img Go To Market Strategy
  • check-imgRegion Specific Market Dynamics
  • check-imgRegion Level Market Share
  • check-img Import Export Analysis
  • check-imgProduction Analysis
  • check-imgOthers