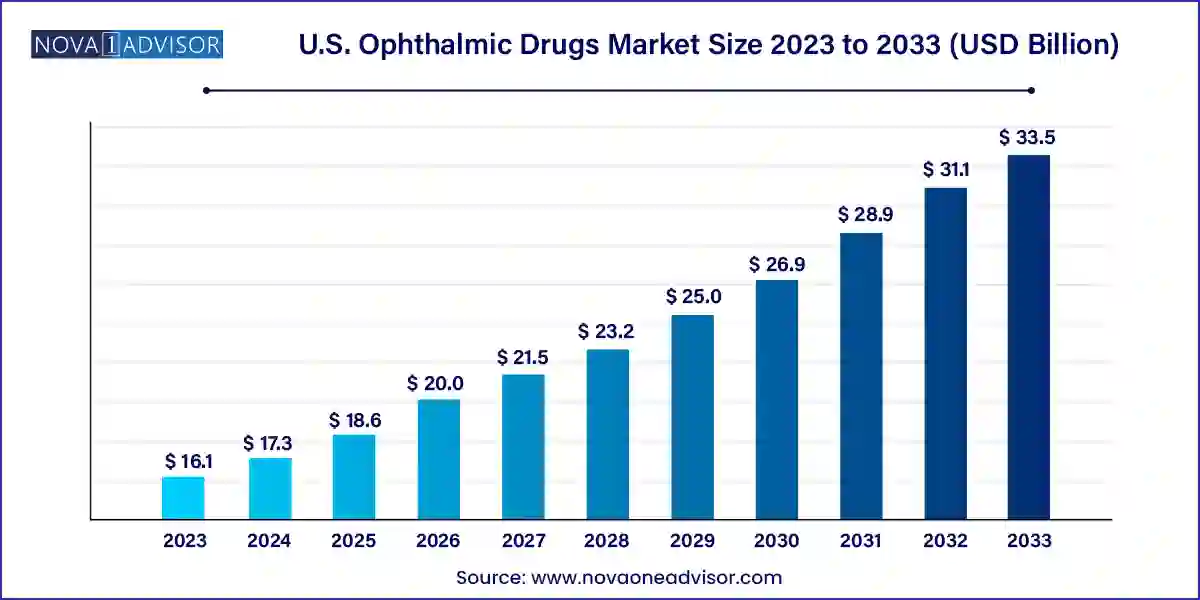
The U.S. ophthalmic drugs market size was exhibited at USD 16.11 billion in 2023 and is projected to hit around USD 33.51 billion by 2033, growing at a CAGR of 7.6% during the forecast period 2024 to 2033.

The U.S. ophthalmic drugs market represents one of the most dynamic and innovation-driven sectors within the pharmaceutical industry, driven by a confluence of demographic shifts, technological advancement, and increasing prevalence of eye disorders. Ophthalmic drugs are formulations designed for treating conditions related to the eyes, including glaucoma, dry eye disease, retinal disorders, infections, allergies, and inflammatory diseases. These therapies are delivered in various dosage forms, such as eye drops, ointments, capsules, and injectables, and may be administered via topical, local ocular, or systemic routes.
Aging demographics in the U.S. play a significant role in market expansion. According to the American Academy of Ophthalmology, nearly 3 million Americans suffer from glaucoma, and over 11 million people are affected by age-related macular degeneration (AMD), a leading cause of vision loss. Moreover, lifestyle-related contributors, such as prolonged screen time, environmental pollution, and systemic diseases like diabetes, are exacerbating ocular health issues, thereby fueling the demand for therapeutic interventions.
Pharmaceutical innovation is a hallmark of this market, with biologics, anti-VEGF agents, and gene therapy candidates gaining ground over conventional therapies. Regulatory agencies such as the FDA have created pathways for accelerated approval of novel ophthalmic drugs, particularly for rare and degenerative eye diseases. Companies are also exploring targeted drug delivery systems, including sustained-release implants and nanotechnology-based formulations, to enhance drug bioavailability and patient compliance. The convergence of biotechnology, personalized medicine, and digital health technologies has positioned the U.S. ophthalmic drugs market for continued expansion.
Rising adoption of anti-VEGF therapies: Anti-VEGF agents have become the gold standard in treating retinal disorders such as AMD and diabetic retinopathy, with multiple innovations underway.
Emergence of gene and cell therapies: The FDA approval of Luxturna and ongoing trials for other ocular gene therapies highlight the growing role of regenerative medicine in ophthalmology.
Increased preference for preservative-free formulations: Patient preference and safety concerns are driving demand for eye drops and ointments that avoid preservatives like benzalkonium chloride.
Integration of digital health in disease management: Tele-ophthalmology and AI-based retinal screening tools are being used to complement pharmacological therapies, particularly in diabetic eye care.
Surge in over-the-counter (OTC) eye care products: Rising self-care trends have led to the growth of OTC solutions for dry eye, allergies, and redness relief.
Development of long-acting ocular drug delivery systems: Companies are exploring implants and depot injections to minimize dosing frequency, especially in chronic conditions like uveitis or wet AMD.
| Report Coverage | Details |
| Market Size in 2024 | USD 17.33 Billion |
| Market Size by 2033 | USD 33.51 Billion |
| Growth Rate From 2024 to 2033 | CAGR of 7.6% |
| Base Year | 2023 |
| Forecast Period | 2024-2033 |
| Segments Covered | Drug Class, Disease, Route of Administration, Dosage Form, Type, Product |
| Market Analysis (Terms Used) | Value (US$ Million/Billion) or (Volume/Units) |
| Regional Scope | U.S. |
| Key Companies Profiled | Pfizer Inc.; Novartis AG; Alcon; Bausch Health Companies Inc.; Merck & Co., Inc.; Regeneron Pharmaceuticals Inc.; AbbVie Inc.; Bayer Corporation; Genentech, Inc.; Nicox Ophthalmics, Inc.; Coherus BioSciences |
A significant driver propelling the U.S. ophthalmic drugs market is the rising incidence of age-related eye diseases, particularly among the expanding geriatric population. The U.S. Census Bureau projects that by 2030, over 20% of the population will be aged 65 and above. This age group is disproportionately affected by conditions such as cataracts, AMD, dry eye syndrome, and glaucoma, leading to increased demand for sustained pharmaceutical intervention.
For example, the prevalence of AMD is expected to affect nearly 22 million Americans by 2050, with a sizable proportion requiring ongoing treatment. Anti-VEGF injections, such as aflibercept and ranibizumab, have become standard-of-care therapies in these cases. Similarly, the aging process is linked to decreased tear production, making chronic dry eye disease a widespread condition. The growing patient pool and the need for maintenance therapy have resulted in consistent demand for both branded and generic ophthalmic drugs. Additionally, rising life expectancy coupled with increased screening and awareness is leading to earlier diagnosis and treatment initiation, amplifying market opportunities.
Despite strong growth prospects, the ophthalmic drugs market is constrained by the inherent complexities of ocular drug delivery. The eye’s unique anatomy, characterized by multiple barriers such as the corneal epithelium, blood-aqueous barrier, and blood-retinal barrier, limits the bioavailability of topically administered drugs. Many compounds fail to reach therapeutic concentrations in the posterior segment of the eye, necessitating frequent dosing or invasive procedures such as intravitreal injections.
These limitations increase treatment burdens and pose risks of complications like infections or retinal detachment. Moreover, the high attrition rate in ophthalmic drug development is a deterrent for pharmaceutical companies, as clinical trials are expensive, time-consuming, and often yield inconclusive efficacy outcomes. Formulation challenges, such as ensuring adequate viscosity, pH balance, and ocular residence time, further complicate product development. These factors collectively constrain innovation and commercial expansion, particularly for small and mid-sized drug developers.
An exciting and transformative opportunity in the U.S. ophthalmic drugs market lies in the rapid advancement of gene and cell therapies aimed at restoring or preserving vision in patients with inherited or degenerative eye diseases. The 2017 FDA approval of Luxturna (voretigene neparvovec) for Leber’s congenital amaurosis marked a watershed moment, showcasing the feasibility and therapeutic potential of ocular gene therapy.
Since then, numerous biopharmaceutical companies have initiated preclinical and clinical trials for gene-based treatments targeting retinitis pigmentosa, Stargardt disease, and dry AMD. Unlike conventional pharmacological treatments that require ongoing administration, gene therapies offer the promise of long-term or even permanent correction with a single dose. This paradigm shift is also driving interest in cell-based approaches, such as retinal pigment epithelium transplantation and stem cell-derived photoreceptor regeneration. As regulatory frameworks evolve and production technologies become more scalable, gene and cell therapies are expected to revolutionize the treatment landscape, especially in previously untreatable ocular conditions.
Anti-VEGF agents dominated the U.S. ophthalmic drugs market, particularly due to their role in treating retinal disorders such as AMD and diabetic retinopathy. Medications like Eylea (aflibercept) and Lucentis (ranibizumab) are widely prescribed and account for a substantial share of the total ophthalmic pharmaceutical expenditure. The introduction of biosimilars and extended-duration formulations is also reshaping the competitive landscape. With increasing rates of diabetes and an aging population, the demand for intravitreal anti-VEGF therapies continues to surge, positioning them as cornerstones of retinal disease management.
Gene and cell therapies are emerging as the fastest-growing segment, propelled by the clinical success of Luxturna and a burgeoning pipeline of novel candidates. These therapies target genetic defects at the root of diseases rather than merely alleviating symptoms. Companies like REGENXBIO, MeiraGTx, and Iveric Bio are actively developing single-dose therapies aimed at halting or reversing retinal degeneration. Although still in early commercialization stages, the long-term potential of gene and cell therapies is immense, especially as more therapies receive regulatory approval and reimbursement support.
Retinal disorders held the largest market share, reflecting the dominance of chronic conditions like macular degeneration and diabetic retinopathy. These disorders often require long-term and high-cost therapies, thereby driving market revenue. Anti-VEGF injections remain the standard treatment, and their usage is supported by robust clinical guidelines and payer reimbursement. The increasing adoption of sustained-release implants and new combination therapies also underlines this segment’s strategic importance.
Dry eye disease is the fastest-growing segment, driven by high prevalence, increased diagnosis rates, and expanding treatment options. Brands like Restasis, Xiidra, and the recently approved Tyrvaya are gaining traction. Moreover, over-the-counter artificial tears and ointments are supplementing prescription therapies. Factors such as prolonged screen time, environmental pollution, LASIK surgeries, and contact lens use have contributed to rising dry eye incidence, prompting greater investment in innovation and formulation diversity.
Topical administration held the largest share, especially for anterior segment diseases like dry eye, allergies, and uveitis. It is favored for its simplicity, localized action, and reduced systemic side effects. Companies are innovating in droplet size reduction, mucoadhesive polymers, and advanced bottle designs to enhance delivery efficiency.
Intravitreal administration is growing rapidly, driven by its necessity in delivering biologics to the posterior segment. The success of anti-VEGF agents has set the stage for extended-release depots and implantable delivery systems, reducing injection frequency and enhancing adherence.
Prescription drugs lead the market, especially for chronic and vision-threatening diseases like glaucoma and macular degeneration. Prescription volumes remain high, and the inclusion of newer biologics and combination therapies continues to raise the bar for treatment outcomes.
OTC drugs are gaining momentum, particularly for allergy relief and dry eye management. Increasing self-care trends, driven by consumer education and awareness, are expanding the OTC portfolio and pharmacy sales volumes.
Branded drugs dominate the market, supported by strong R&D investment, marketing capabilities, and clinical superiority. Brands like Eylea, Restasis, and Xiidra have built significant brand equity and patient trust.
Generic drugs, however, are growing at a faster pace, aided by the expiry of patents on several blockbuster drugs and the FDA's push for increased access and affordability. The entry of generic versions of prednisolone acetate and timolol maleate has opened new price-sensitive markets.
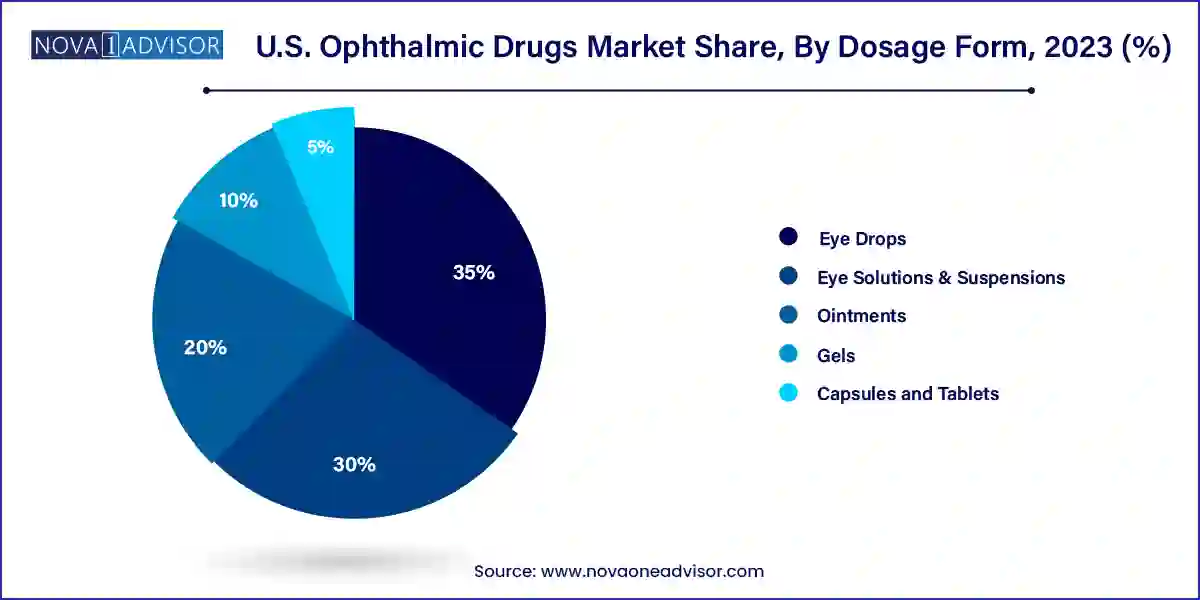
Eye drops dominated the dosage form segment, given their ease of use, high patient compliance, and wide applicability across various eye conditions, from allergies to glaucoma. Prescription and OTC formulations in drop form continue to generate the highest volume of prescriptions. Pharmaceutical firms are enhancing formulations with viscosity enhancers, preservative-free options, and combination drops to improve efficacy and safety.

Capsules and tablets are emerging as a fast-growing alternative, particularly for systemic treatment of inflammatory conditions and retinal health supplements. Nutraceuticals with antioxidant and anti-inflammatory properties targeting retinal health have seen increased use, especially among the elderly population. This shift suggests a growing interest in holistic and preventative approaches to eye care.
The U.S. is the global leader in ophthalmic drug development and commercialization, driven by its sophisticated healthcare infrastructure, high per capita healthcare expenditure, and early adoption of medical innovations. The country houses some of the world’s most prominent pharmaceutical firms, specialized eye care institutions, and research universities. Regulatory frameworks provided by the FDA ensure robust evaluation and expedited approvals for orphan and breakthrough therapies in ophthalmology.
States such as California, New York, and Massachusetts serve as R&D hubs, hosting biotech clusters and research institutions focused on ocular science. In addition, insurance coverage for advanced therapies through Medicare, Medicaid, and private payers facilitates broader access to ophthalmic medications. The U.S. also sees strong advocacy and education from organizations such as the American Academy of Ophthalmology (AAO) and the National Eye Institute, which play a critical role in shaping care delivery models and supporting innovation in eye health.
April 2024 – AbbVie announced FDA approval for Elysium, a novel steroidal eye drop for chronic eye inflammation, designed to provide rapid relief with fewer dosing requirements, showcasing the company’s continued investment in topical formulations.
March 2024 – Regeneron Pharmaceuticals received fast-track designation from the FDA for aflibercept 8 mg, an extended-duration formulation targeting wet AMD, reducing the need for frequent injections.
February 2024 – Alcon launched a new preservative-free version of its Systane Complete eye drops, in response to consumer demand for gentler formulations for chronic dry eye sufferers.
January 2024 – Bausch + Lomb completed the acquisition of Aciex Therapeutics, expanding its ophthalmic portfolio with several late-stage candidates for ocular allergies and infection.
This report forecasts revenue growth at country levels and provides an analysis of the latest industry trends in each of the sub-segments from 2021 to 2033. For this study, Nova one advisor, Inc. has segmented the U.S. ophthalmic drugs market
Drug Class
Disease
Dosage Form
Route of Administration
Type
Product