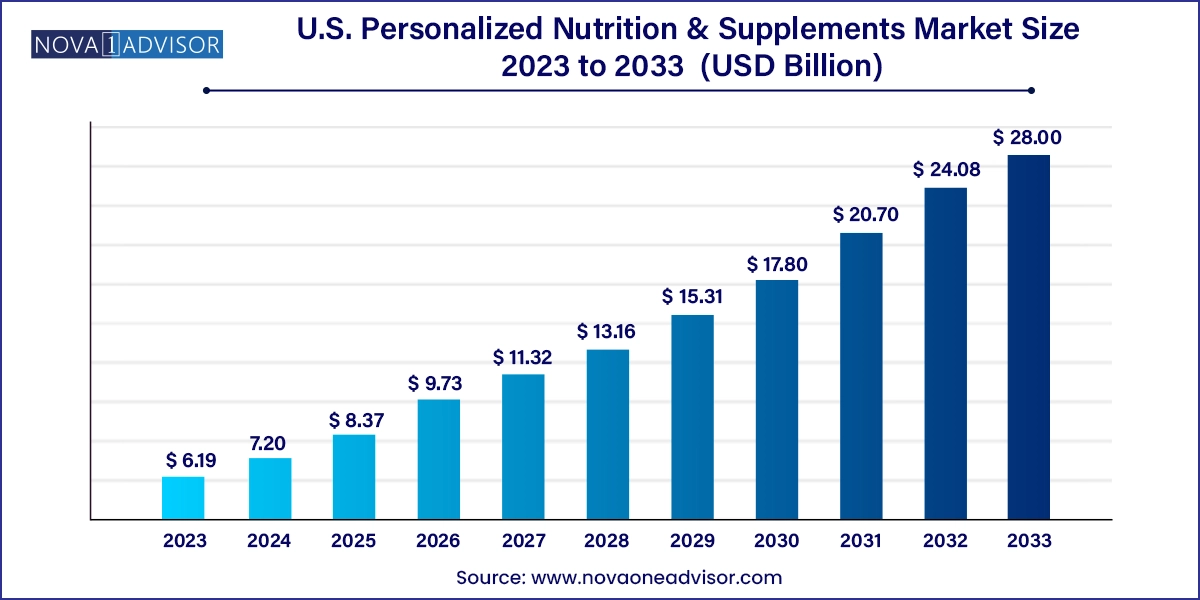
The U.S. personalized nutrition & supplements market size was valued at USD 6.19 billion in 2023 and is anticipated to reach around USD 28 billion by 2033, growing at a CAGR of 16.29% from 2024 to 2033.

The U.S. personalized nutrition and supplements market has witnessed significant growth over the last decade, fueled by a confluence of technological innovation, changing consumer attitudes toward health, and the rise of digital health platforms. Personalized nutrition involves tailoring dietary and supplement recommendations to an individual’s unique genetic makeup, lifestyle, metabolic profile, or health goals. Unlike the one-size-fits-all model of traditional supplementation, this approach offers a high degree of customization providing more effective results and higher consumer satisfaction.
This market has rapidly evolved from a niche offering to a mainstream health solution, largely due to increasing awareness of preventive health, growing incidences of chronic diseases, and heightened focus on wellness post-COVID-19. Companies are increasingly offering DNA-based nutrition recommendations, microbiome testing, wearable device integrations, and dynamic health assessments. For instance, organizations such as Persona Nutrition and Care/of use online assessments to formulate daily supplement packs, while others like Viome analyze gut microbiome profiles to craft unique dietary recommendations.
The growing popularity of at-home testing kits, digital diagnostics, and artificial intelligence in creating real-time feedback loops has made personalized nutrition not only more accessible but also more affordable. The convergence of tech and wellness, along with increasing consumer demand for transparency, sustainability, and scientific backing, is shaping a dynamic and competitive landscape in the U.S. market.
Integration of DNA and Microbiome Testing: Companies are incorporating genomics and gut health diagnostics to create more precise and tailored nutrition plans.
AI and Machine Learning-Based Recommendations: Use of algorithms to analyze consumer data (diet, activity, biometrics) and recommend supplement regimens.
Subscription-Based Delivery Models: Monthly personalized supplement packs delivered directly to consumers’ doors are becoming the norm.
Clean Label and Plant-Based Preferences: Consumers are leaning toward supplements with natural, organic, and plant-based ingredients, avoiding synthetic additives.
Gamification and Mobile Apps: Brands are building interactive mobile platforms to engage consumers and track nutritional goals via gamified features.
Growth of Direct-to-Consumer (DTC) Brands: More brands are bypassing traditional retail and selling directly through e-commerce, offering personalized onboarding and faster delivery.
Men’s and Women’s Wellness Differentiation: Gender-specific health supplements tailored to hormonal and physiological needs are gaining traction.
Sustainable Packaging and Transparency: Environmentally responsible packaging and complete ingredient traceability are becoming important buying factors.
| Report Attribute | Details |
| Market Size in 2024 | USD 7.20 Billion |
| Market Size by 2033 | USD 28 Billion |
| Growth Rate From 2024 to 2033 | CAGR of 16.29% |
| Base Year | 2023 |
| Forecast Period | 2024 to 2033 |
| Segments Covered | Ingredient, dosage form, age group, distribution channel |
| Market Analysis (Terms Used) | Value (US$ Million/Billion) or (Volume/Units) |
| Report Coverage | Revenue forecast, company ranking, competitive landscape, growth factors, and trends |
| Key Companies Profiled | Viome Life Sciences, Inc.; DSM Nutritional Products AG; Thorne; HUM Nutrition, Inc.; GenoPalate Inc; Pharmavite; GNC Holdings, LLC; The Vitamin Shoppe; Nestlé Health Science (Nestlé); Baze Labs; InVite Health |
One of the most significant drivers fueling the U.S. personalized nutrition & supplements market is the growing consumer awareness of preventive healthcare. As healthcare costs soar and chronic lifestyle diseases such as diabetes, obesity, cardiovascular disorders, and gut-related ailments continue to rise, consumers are seeking proactive ways to manage their health. Personalized nutrition enables individuals to address specific deficiencies and optimize well-being, often preventing or mitigating disease onset.
Surveys conducted in 2024 indicate that over 70% of U.S. consumers are now more inclined to purchase vitamins and dietary supplements tailored to their health goals, compared to just 48% five years ago. This shift reflects a deeper trust in science-based, personalized regimens over generic products. The COVID-19 pandemic acted as a catalyst, urging individuals to explore immunity-boosting strategies, including targeted supplementation. The continued consumer shift toward longevity and preventive wellness ensures robust and sustained market momentum.
Despite its immense potential, the market faces a key restraint in the form of high cost and affordability barriers. Personalized nutrition programs, particularly those based on DNA sequencing, blood biomarker analysis, or microbiome assessments, often come with a premium price tag. While affluent segments in the U.S. can afford these solutions, middle-income consumers may find the entry point expensive, especially in the absence of insurance reimbursement.
Moreover, many personalized supplement brands are not covered by healthcare plans, making out-of-pocket expenditures significant. For instance, comprehensive packages that include DNA testing, nutritionist consultations, and a 30-day supplement pack can cost upward of $100–$200/month. These costs deter adoption, especially when cheaper over-the-counter alternatives are available. Addressing this challenge will require either cost innovations from providers or policy-level changes enabling partial insurance coverage.
An exciting opportunity lies in the integration of digital health platforms, artificial intelligence (AI), and real-time biometrics. Wearables such as smartwatches and fitness trackers can now monitor metrics like sleep, heart rate variability, and physical activity, offering rich datasets for customized nutritional feedback. Companies are leveraging AI to interpret this data and continuously adapt supplement plans.
For example, platforms like Nutrigenomix and InsideTracker analyze multiple biological markers and provide tailored nutrition and lifestyle recommendations. With more than 50% of U.S. adults using at least one health app, the potential for scalable, AI-driven personalization is immense. As these technologies become more sophisticated and user-friendly, they will bring precision nutrition to the masses, enabling longitudinal monitoring and adaptive supplementation based on individual health trajectories.
Vitamins dominated the U.S. personalized nutrition & supplements market by ingredient, thanks to their ubiquitous presence in general health maintenance and preventive care. Vitamin D, Vitamin C, and B-complex vitamins are particularly in demand for immunity, energy, and stress management. Personalized assessments often reveal deficiencies in these micronutrients, prompting tailored interventions. Many companies now offer customized vitamin packs based on individual lab results, survey responses, or wearable data. Additionally, increased awareness of immune health post-COVID has driven demand for vitamin-based personalization.
Probiotics are the fastest-growing ingredient segment, driven by the mounting evidence linking gut health to overall well-being. Personalized probiotics are now being formulated based on microbiome sequencing, which identifies specific bacterial imbalances. Brands such as Viome and Seed Health are leading this niche by offering microbiome testing kits followed by personalized probiotic regimens. The growing interest in digestive health, mental well-being (gut-brain axis), and skin health is reinforcing the demand for probiotic personalization.
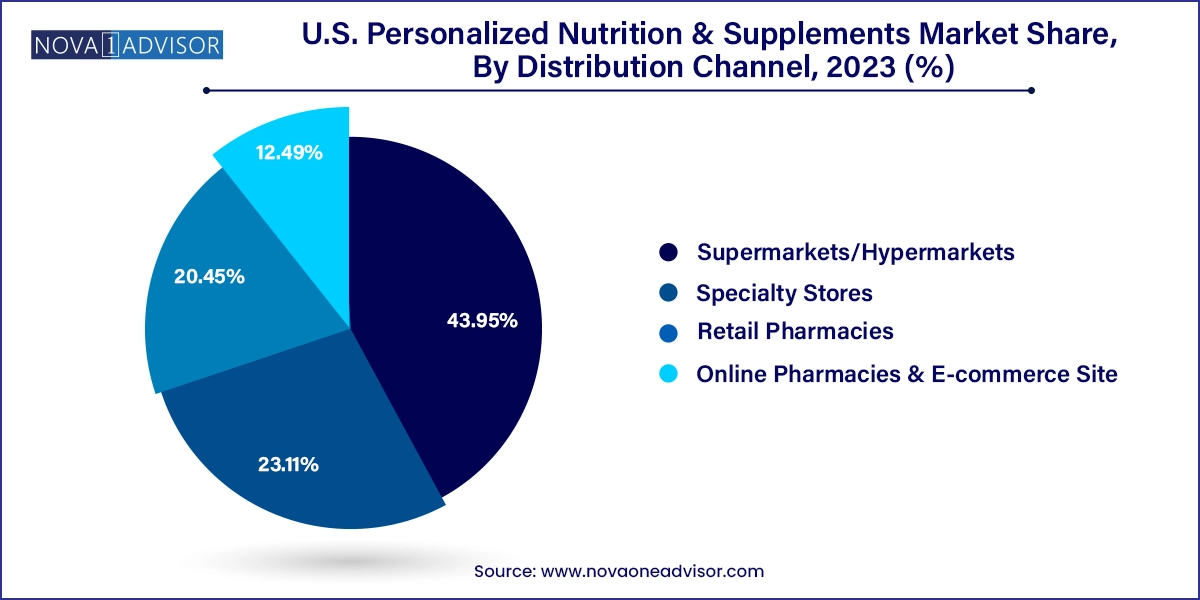
Online pharmacies and e-commerce sites dominated the market, reflecting the broader shift toward digital consumption. Personalized nutrition thrives in online ecosystems where users can fill out health assessments, track their goals, and receive tailored deliveries without stepping into a store. E-commerce offers convenience, privacy, and access to subscription-based services. Brands like Rootine and Baze exemplify the digital-first approach with DTC supplement personalization and ongoing virtual consultations.

Retail pharmacies are emerging as the fastest-growing offline distribution channel, as they blend in-store expertise with digital tools. Major pharmacy chains like CVS and Walgreens have begun offering personalized vitamin services using kiosk-based assessments or app integrations. Consumers benefit from pharmacist guidance while enjoying quicker access to products. Retailers are also increasingly stocking personalized kits and diagnostics, merging the trust of traditional pharmacy with the innovation of customized wellness.
ablets and capsules held the largest market share by dosage form, owing to their convenience, stability, and consumer familiarity. These formats dominate across multivitamins, minerals, and herbal supplements, and are often used in DTC subscription models. Personalized pill packs custom-labeled with the consumer’s name and instructions are a hallmark of services offered by players like Care/of and Persona Nutrition.
Powders emerged as the fastest-growing segment, especially in protein and botanical-based supplements tailored for fitness, sleep, and metabolism. Many wellness brands now offer flavored, mixable powders customized to a consumer’s goals—like weight loss, muscle gain, or relaxation. These powders also allow more flexible dosage adjustments and easier incorporation into daily routines. Moreover, clean-label, vegan, and gluten-free powders are gaining momentum among Millennials and Gen Z populations.
Adults were the dominant consumer segment, comprising the bulk of purchases in the personalized supplements market. Adults between 25–50 are more likely to engage in self-initiated health tracking, online consultations, and purchase premium wellness products. This demographic also experiences higher stress, poor sleep, and sedentary lifestyle-related issues, making them key targets for personalized interventions like adaptogens, magnesium, and nootropics.
Geriatrics represent the fastest-growing age segment, driven by increased life expectancy and the rising senior population in the U.S. Seniors are more prone to nutrient malabsorption, chronic diseases, and polypharmacy concerns. Personalized nutrition programs offer tailored regimens that avoid harmful interactions, improve cognitive function, and support mobility. Companies are now crafting senior-focused supplement packages that adjust to changing health conditions, such as joint deterioration, cardiovascular risk, and vision decline.
The United States presents a diverse and complex consumer base for personalized nutrition and supplements. Urban populations in states such as California, New York, Florida, and Texas are particularly active consumers due to higher digital literacy, greater disposable incomes, and cultural openness to innovation. California especially cities like Los Angeles and San Francisco—is a hotspot for tech-health integrations and DTC wellness startups.
Meanwhile, the Midwest and Southeast are emerging markets driven by increasing awareness and healthcare outreach initiatives. The demand here is more centered on affordability and value, which has encouraged local brands to offer more budget-conscious personalized options. The U.S. also benefits from a mature regulatory infrastructure (FDA, DSHEA), an expansive insurance landscape, and a dynamic research ecosystem supporting innovation. While the market is currently more penetrated in affluent metros, rural regions and middle-income segments represent vast untapped potential.
This report forecasts revenue growth at country levels and provides an analysis of the latest industry trends in each of the sub-segments from 2021 to 2033. For this study, Nova one advisor, Inc. has segmented the U.S. Personalized Nutrition & Supplements market.
By Ingredient
By Dosage Form
By Age Group
By Distribution Channel