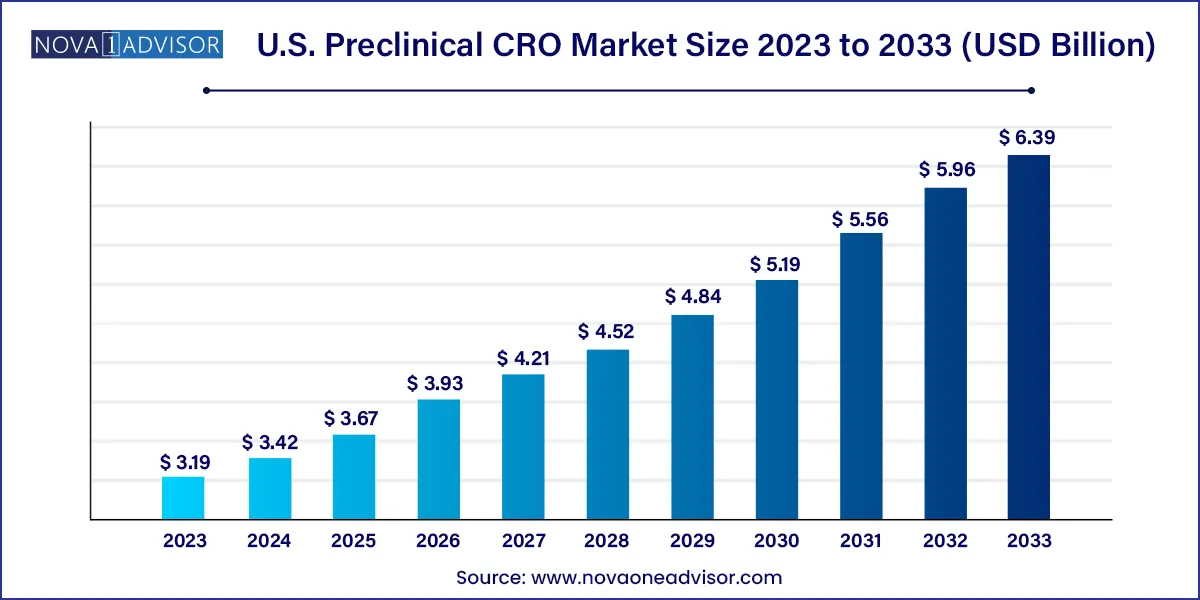
The U.S. preclinical CRO market size was valued at USD 3.19 billion in 2023 and is projected to surpass around USD 6.39 billion by 2033, registering a CAGR of 7.2% over the forecast period of 2024 to 2033.

The U.S. preclinical contract research organization (CRO) market is a critical segment of the pharmaceutical and biotechnology industry, acting as a foundational element in the drug development pipeline. Preclinical CROs support pharmaceutical, biotech, and medical device companies in evaluating the safety, efficacy, pharmacodynamics, and pharmacokinetics of investigational compounds before they are allowed to proceed into human trials.
These organizations provide an expansive range of services, including in vivo and in vitro studies, bioanalysis, DMPK (Drug Metabolism and Pharmacokinetics) assessments, toxicology, safety pharmacology, and discovery research. This support enables sponsors to reduce time-to-market, optimize internal resource allocation, and ensure regulatory compliance with agencies such as the FDA.
As the cost and complexity of drug development rise, U.S. pharmaceutical and biotech companies are increasingly outsourcing early-stage R&D activities to CROs with specialized expertise, infrastructure, and regulatory knowledge. The U.S. market is particularly robust due to its concentration of top-tier academic institutions, leading pharma companies, and a well-defined regulatory framework that encourages innovation while maintaining patient safety.
Additionally, the increasing prevalence of chronic diseases, rising demand for personalized medicine, and the explosion of biopharmaceutical pipelines have expanded the scope of preclinical research. In response, CROs are investing in cutting-edge technologies like organoids, AI-driven modeling, and molecular imaging to provide more predictive and ethically sound alternatives to traditional animal models.
The U.S. preclinical CRO industry is undergoing strategic consolidation, digital transformation, and service diversification to meet the evolving needs of sponsors, making it one of the most dynamic segments in life sciences outsourcing.
Growing Use of Organoid and Cell Culture Models: Ethical concerns and translational limitations of animal models are driving adoption of advanced 3D and organoid models.
Shift Toward Integrated Drug Discovery Platforms: Full-suite CROs are offering target discovery through preclinical development under a unified platform.
Increased Demand for Non-GLP Toxicology Studies: Biotech startups are seeking faster, cost-effective toxicology insights pre-IND filing.
Adoption of AI and Machine Learning: AI-driven data analytics and predictive modeling are being deployed in compound screening and safety evaluation.
Expansion in Imaging-Based Biomarkers: Advanced imaging modalities like PET, MRI, and CT are enhancing non-invasive evaluations in vivo.
Emphasis on Rare Disease and Orphan Drug Research: CROs are tailoring preclinical strategies to meet the regulatory pathways of orphan drug development.
Rising Collaborations Between CROs and Academic Institutions: To access proprietary models and experimental techniques.
Growth in Biologics and Cell/Gene Therapy Pipelines: Preclinical CROs are expanding immunogenicity and biodistribution studies to support complex biologics.
State-Level Incentives and Incubator Programs: U.S. states like Massachusetts and North Carolina are promoting CRO clusters through tax credits and grants.
Hybrid CRO Models Emerging: Combining boutique expertise with the scalability of large CROs through M&A and partnerships.
| Report Attribute | Details |
| Market Size in 2024 | USD 3.42 Billion |
| Market Size by 2033 | USD 6.39 Billion |
| Growth Rate From 2024 to 2033 | CAGR of 7.2% |
| Base Year | 2023 |
| Forecast Period | 2024 to 2033 |
| Segments Covered | Service, model type, technology, end-use, state |
| Market Analysis (Terms Used) | Value (US$ Million/Billion) or (Volume/Units) |
| Report Coverage | Revenue forecast, company ranking, competitive landscape, growth factors, and trends |
| Key Companies Profiled | Laboratory Corporation of America; Lonza; WuXi AppTec, Inc.; Eurofins Scientific SE; Intertek Group plc; Medpace Holdings, Inc.; Charles River Laboratories International, Inc.; SGA SA; Pharmaceutical Product Development, Inc. (Thermo Fisher Scientific, Inc.); ICON plc; CROWN bioscience |
The most significant driver for the U.S. preclinical CRO market is the rapid expansion of the biopharmaceutical pipeline, coupled with increased outsourcing of early-stage R&D. With over 20,000 drug candidates globally in various stages of development—and more than 5,000 of them in the U.S. alone pharmaceutical and biotech companies are under pressure to move from discovery to IND filing efficiently and cost-effectively.
Given the intense competition and limited internal R&D bandwidth, especially among small-to-mid-sized biotechs, CROs have become essential partners. They provide scalable access to resources, cutting-edge animal models, molecular imaging platforms, and regulatory expertise. Moreover, large pharma firms are increasingly embracing “external innovation” models, expanding the preclinical CRO market’s client base and revenue potential.
These trends are further reinforced by the move toward precision medicine, where tailored therapies require a deep understanding of target biology and toxicological profiles. CROs offer specialized services such as custom synthesis, PK/PD modeling, and safety pharmacology to facilitate these developments. As a result, demand for U.S.-based preclinical CRO services is expected to remain high across both discovery and regulatory-preparatory stages.
Despite robust demand, the high cost and complexity of maintaining GLP compliance, ethical approvals, and safety standards remain a challenge for preclinical CROs in the U.S. The FDA’s stringent requirements for preclinical safety studies under GLP protocols demand constant investments in personnel training, infrastructure, documentation, and audit readiness.
Startups and mid-sized CROs often struggle with the financial burden of operating advanced animal facilities or maintaining licenses for radioactive and imaging agents. The need to manage multi-state regulations and Institutional Animal Care and Use Committee (IACUC) approvals adds to operational friction.
Additionally, evolving expectations around reproducibility, data transparency, and animal welfare (e.g., the 3Rs—Replacement, Reduction, Refinement) are putting pressure on CROs to upgrade technologies and adopt alternative models, which may not yet be reimbursable or widely validated. These cost and compliance factors can restrict market entry and limit scalability, particularly for niche providers.
A growing opportunity lies in the adoption of advanced in vitro systems such as organoid models, 3D tissue constructs, and microfluidic chips. These systems offer higher physiological relevance compared to traditional 2D cultures and better mimic human pathophysiology, making them ideal for oncology, neurology, and rare disease studies.
The U.S. FDA’s willingness to consider non-animal alternatives, coupled with recent legislative momentum (e.g., the FDA Modernization Act 2.0), is propelling investment in alternative preclinical models. Organoids are particularly gaining traction in immuno-oncology research, allowing co-culture studies with patient-derived immune cells.
CROs that offer expertise in developing, validating, and integrating these models into IND-enabling workflows are well-positioned to capture new business. Biopharma firms are increasingly seeking partners who can provide translationally relevant data with reduced ethical burdens and faster turnaround times. As precision medicine advances, demand for personalized organoid libraries and disease modeling is expected to skyrocket, presenting a lucrative niche for innovative CROs.
Toxicology Testing dominates the U.S. preclinical CRO market, accounting for a substantial portion of outsourced services due to its mandatory role in IND submissions. Within this, both GLP and non-GLP studies are widely used. GLP studies are critical for regulatory filings, while non-GLP assessments offer early insight into compound safety, often requested by startups during candidate screening. The increasing complexity of biologics and need for repeated dose toxicity, genotoxicity, and reproductive studies further underscores the importance of toxicology CROs.
Discovery Research is the fastest-growing segment, as more drug sponsors outsource upstream R&D to manage risk and focus internal teams on clinical-stage assets. This includes target identification, high-throughput screening, lead optimization, and functional genomics. Technologies like CRISPR, RNAi, and AI-driven compound design are being embedded into preclinical workflows, making this segment highly attractive for innovation-driven biotechs and academic collaborations.
Small Animal Models, particularly mice and rats, remain the cornerstone of preclinical research, offering cost-efficiency and well-characterized genetic tools. Their use is ubiquitous in pharmacokinetics, toxicology, and efficacy studies, especially for cancer, autoimmune, and metabolic disease models.
Organoid Models are emerging as the fastest-growing segment, driven by demand for high-content screening, reduced animal use, and personalized medicine applications. These models replicate tissue-specific responses, allow patient-derived customization, and enable immune-oncology co-culture studies. Their utility in bridging the translational gap between in vitro data and human trials is increasingly appreciated by regulators and sponsors alike.
In Vivo Studies dominate due to their regulatory necessity, particularly in toxicology, safety pharmacology, and efficacy testing. Imaging technologies, such as MRI and PET, enhance data richness and enable non-invasive monitoring of disease progression in live animals.
Imaging Technologies, specifically MRI and PET-CT, are among the fastest-growing, as they allow longitudinal tracking of treatment effects and biodistribution without sacrificing the test subject. Their role in accelerating drug timelines, especially for CNS and oncology assets, is making them a high-demand service offering for CROs with advanced facilities.
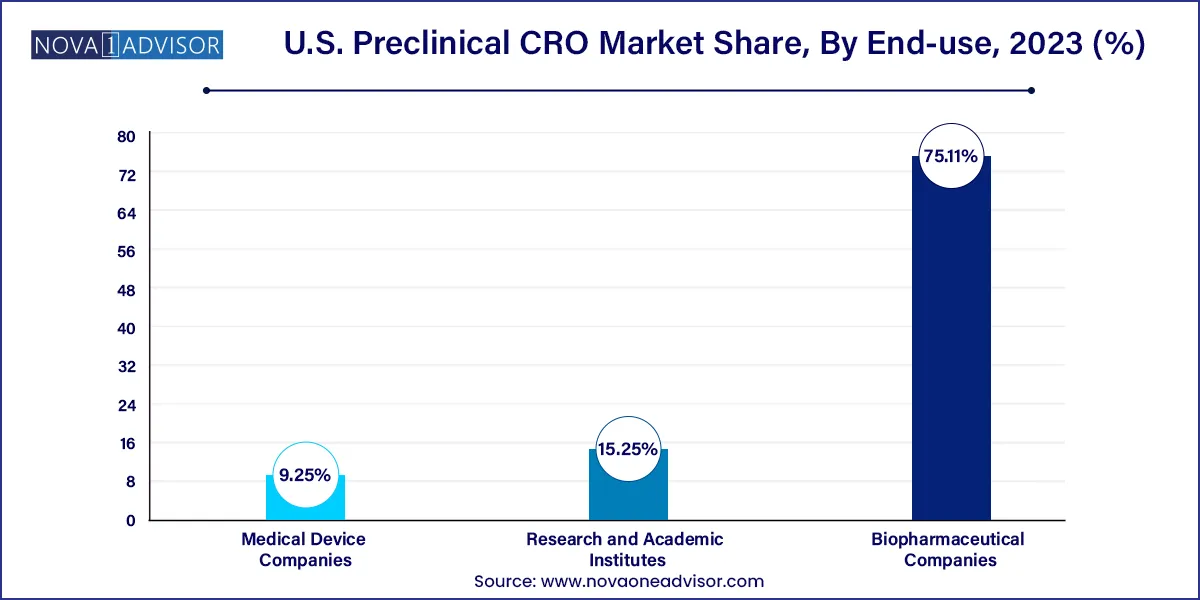
Biopharmaceutical Companies are the primary clients for preclinical CROs, outsourcing entire pipelines or individual service modules. These companies rely on CROs to reduce overhead, maintain compliance, and expedite development timelines, especially for complex therapies like ADCs, mRNA vaccines, and cell therapies.

Medical Device Companies represent a growing end-user base, particularly those developing combination products, implantables, or drug delivery systems. These firms need preclinical data to meet FDA requirements for device-biologic interactions, making specialized CROs indispensable for pre-market studies.
The U.S. dominates the global preclinical CRO market due to its concentration of top pharmaceutical companies, world-class academic institutions, and early-stage biotech innovation hubs. States like Massachusetts, California, and North Carolina host thriving life sciences ecosystems, while regions like New Jersey and Pennsylvania benefit from legacy pharma infrastructure and access to experienced regulatory consultants.
The presence of FDA headquarters and clear regulatory pathways provides CROs in the U.S. a significant advantage in aligning studies with IND expectations. Furthermore, robust VC funding, government-backed R&D incentives, and proximity to sponsor firms ensure a continuous pipeline of outsourced projects.
As the U.S. expands its investments in pandemic preparedness, biodefense, and advanced therapeutics, the role of domestic preclinical CROs is becoming increasingly strategic to national health and innovation agendas.
March 2025: Charles River Laboratories announced a new expansion of its North Carolina preclinical site, adding 150,000 square feet dedicated to safety pharmacology and large animal models to meet growing demand in gene therapy and rare disease programs.
February 2025: Labcorp Drug Development (formerly Covance) launched a digital platform integrating AI-based data analysis for its toxicology and bioanalysis services, aimed at reducing reporting time by 30%.
January 2025: Bioanalytical Systems Inc. (Inotiv) opened a new organoid research facility in Indiana, supporting immuno-oncology and neurodegenerative drug pipelines with customizable human tissue models.
December 2024: PsychoGenics Inc. received NIH funding to expand its behavioral phenotyping platform using AI-driven endpoints for CNS drug discovery.
November 2024: Eurofins Scientific announced strategic partnerships with multiple biopharma firms in the U.S. to provide GLP-compliant toxicology support for novel RNA-based therapeutics.
Some of the key players operating in the market include Laboratory Corporation of America, Eurofins Scientific SE, Charles River Laboratories International, Inc., CROWN bioscience.
This report forecasts revenue growth at country levels and provides an analysis of the latest industry trends in each of the sub-segments from 2021 to 2033. For this study, Nova one advisor, Inc. has segmented the U.S. Preclinical CRO market.
By Service
By Model Type
By Technology
By End-use
By State