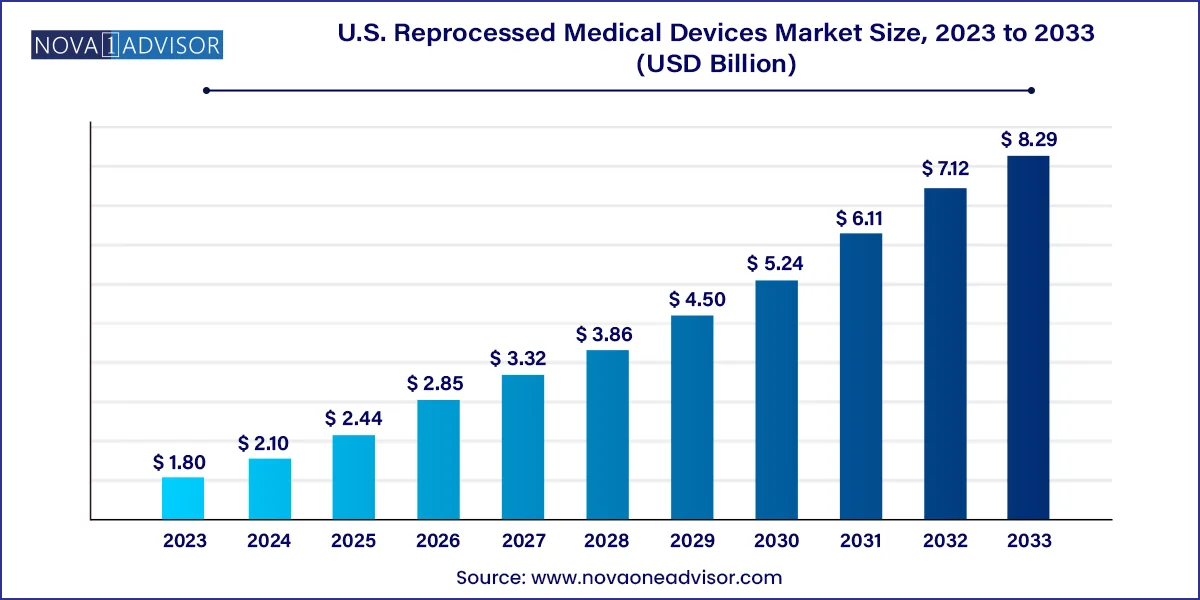
The U.S. reprocessed medical devices market size was exhibited at USD 1.80 billion in 2023 and is projected to hit around USD 8.29 billion by 2033, growing at a CAGR of 16.5% during the forecast period 2024 to 2033.

The U.S. reprocessed medical devices market represents a vital and rapidly expanding segment of the overall healthcare landscape. Reprocessed medical devices are previously used single-use devices that have undergone a thorough cleaning, sterilization, and testing process to ensure they are safe and effective for reuse. This process not only provides a cost-effective alternative for healthcare providers but also significantly reduces medical waste and its environmental impact. Hospitals and healthcare providers across the United States have increasingly turned to reprocessed devices to optimize operational efficiencies and cost savings.
This market's growth is supported by heightened pressure to reduce healthcare costs, increasing acceptance by healthcare professionals, stringent FDA regulations that ensure patient safety, and a growing awareness of environmental sustainability. Reprocessed devices are now being used across a wide range of medical applications, including cardiovascular, orthopedic, laparoscopic, gastroenterology, and general surgeries. As medical institutions continue to adopt value-based care strategies, reprocessing has emerged as a key strategy to balance quality and affordability.
Increasing Hospital Adoption: Hospitals in the U.S. are increasingly relying on reprocessed devices as a method to reduce procurement costs without compromising patient care.
Regulatory Endorsement: The U.S. Food and Drug Administration (FDA) has provided clear guidance on the reprocessing of single-use devices, enhancing confidence among providers.
Sustainability Initiatives: Environmental consciousness among healthcare institutions is promoting the adoption of reprocessed devices to cut down on landfill waste.
Technological Advancements: Innovations in sterilization and performance validation methods are making reprocessed devices safer and more reliable.
Public-Private Partnerships: Collaborations between hospitals and third-party reprocessing companies are enhancing efficiency and compliance.
Integration of Data Analytics: Use of data analytics in device tracking and performance monitoring is improving decision-making in device reuse.
Expansion of Reprocessable Device Categories: Manufacturers are expanding the range of devices eligible for reprocessing, thus broadening the market scope.
| Report Coverage | Details |
| Market Size in 2024 | USD 2.10 Billion |
| Market Size by 2033 | USD 8.29 Billion |
| Growth Rate From 2024 to 2033 | CAGR of 16.5% |
| Base Year | 2023 |
| Forecast Period | 2024-2033 |
| Segments Covered | Product Type, Type, End-use |
| Market Analysis (Terms Used) | Value (US$ Million/Billion) or (Volume/Units) |
| Country scope | U.S. |
| Key Companies Profiled | Stryker; Innovative Health; NEScientific, Inc.; Medline Industries, Inc; Arjo; Vanguard AG; Cardinal Health; SureTek Medical; Soma Tech Intl; Johnson & Johnson Services, Inc. |
Cost Efficiency and Hospital Budget Optimization
One of the primary drivers propelling the growth of the U.S. reprocessed medical devices market is the significant cost savings associated with reusing high-cost medical devices. Hospitals in the United States face immense financial pressure to reduce spending while maintaining quality care. Reprocessed devices can offer savings of up to 50% compared to new single-use devices. These savings can then be redirected towards improving patient outcomes, investing in new technologies, or enhancing hospital infrastructure. For instance, a 2022 case study involving a large New York-based hospital reported an annual cost reduction of over $2 million by implementing a comprehensive device reprocessing program. This financial incentive, coupled with a growing acceptance among healthcare professionals, makes reprocessing a key component of strategic hospital management.
Concerns Regarding Device Safety and Efficacy
Despite regulatory approvals and advancements in reprocessing technology, concerns about the safety and efficacy of reprocessed devices remain a significant restraint. Some healthcare professionals and patients continue to perceive reprocessed devices as inferior or risk-laden. Any instances of device failure or infection—regardless of their rarity—can lead to negative perceptions and reduced adoption. While the FDA has established rigorous guidelines and mandates detailed documentation of the reprocessing cycle, overcoming this skepticism requires continuous education, transparency, and demonstrable outcomes. Moreover, litigation risks associated with the reuse of devices add a layer of complexity for hospitals, especially in the absence of robust liability protections.
Sustainability and Environmental Impact Reduction
With climate change and environmental sustainability taking center stage across sectors, the healthcare industry is under scrutiny for its ecological footprint. Reprocessed medical devices offer a tangible opportunity to reduce medical waste significantly. For example, it is estimated that U.S. hospitals generate over 5 million tons of waste annually, a large portion of which includes disposable medical devices. By adopting reprocessing, hospitals can contribute to sustainability goals while gaining reputational advantages. Sustainability reporting is increasingly influencing stakeholder decisions, and reprocessing aligns with corporate social responsibility (CSR) initiatives. This intersection of cost savings and eco-consciousness provides a compelling opportunity for stakeholders across the healthcare ecosystem.
The cardiovascular segment dominated the U.S. reprocessed medical devices market in 2024, accounting for the largest share among all product types. Cardiovascular devices, particularly diagnostic electrophysiology catheters and deep vein thrombosis compression sleeves, are high-cost instruments commonly used in hospitals. Due to their complexity and frequency of use, these devices are often reprocessed to reduce costs. Diagnostic electrophysiology catheters, for instance, represent a significant cost burden if procured new for each procedure. Reprocessed alternatives have demonstrated equal efficacy in clinical settings, encouraging adoption. Blood pressure cuffs and cardiac stabilization devices are also frequently reprocessed due to their relatively simpler structure and minimal performance deterioration post-reprocessing.
The fastest-growing segment is laparoscopic devices, especially endoscopic trocars and harmonic scalpels. These instruments are increasingly used in minimally invasive procedures, which are gaining popularity due to reduced recovery time and better patient outcomes. As more hospitals adopt laparoscopic surgical techniques, the demand for affordable and efficient instruments like reprocessed endoscopic trocars has surged. Moreover, advances in reprocessing technologies ensure these devices retain their functional integrity and sterility, facilitating their safe reuse in sensitive procedures. Given the higher unit costs of new laparoscopic tools, their reprocessing not only offers economic benefits but also supports broader implementation of minimally invasive surgeries.
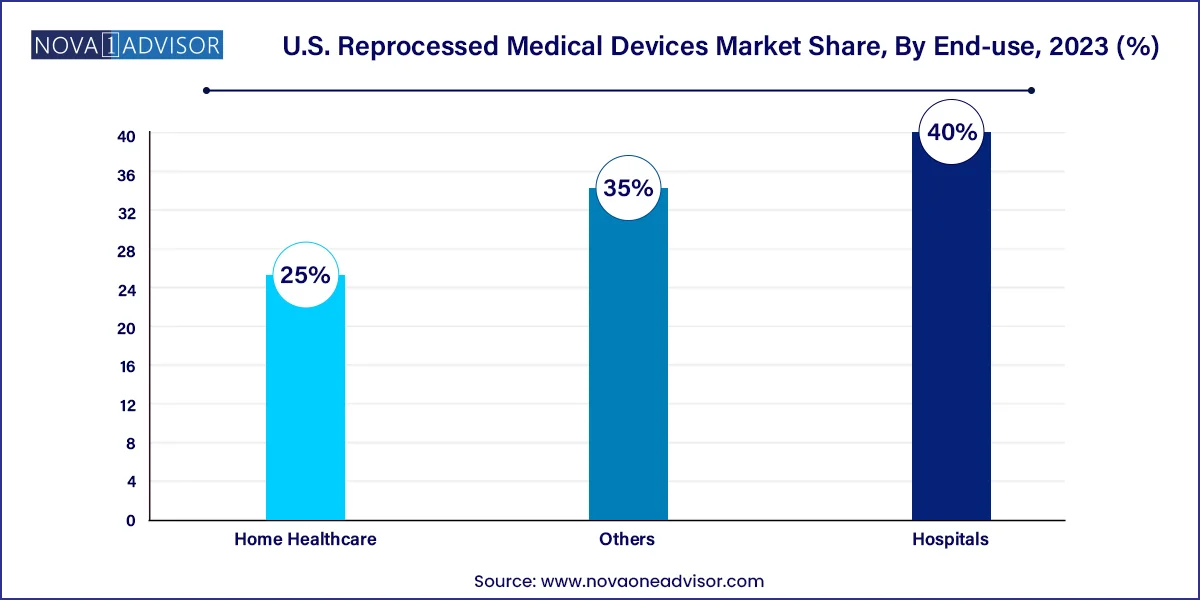
Hospitals dominate the end-use segment of the reprocessed medical devices market in the U.S. Hospitals account for the largest consumption of medical devices and have the infrastructure and resources to manage large-scale reprocessing programs. Moreover, they face significant cost pressures and are incentivized to pursue cost-saving initiatives. Hospitals also benefit from economies of scale in device procurement and reprocessing, making the financial case for reuse particularly strong. In addition, the presence of skilled personnel and stringent quality control systems facilitates the safe and efficient use of reprocessed instruments.

The home healthcare segment is witnessing the fastest growth in adoption. As more patients opt for home-based care—especially in post-operative and chronic care scenarios—there is rising demand for affordable medical devices. Reprocessed devices such as blood pressure cuffs and compression sleeves are becoming commonplace in home settings. Their lower cost makes them accessible for long-term use, while advances in user-friendly designs have improved patient compliance. The growing elderly population and emphasis on decentralized healthcare delivery are likely to further boost this segment in the coming years.
Third-party reprocessing led the U.S. market in 2024 and remains the most widely adopted method. This segment benefits from standardized practices, regulatory compliance, and dedicated expertise that third-party service providers bring to the table. Third-party firms follow FDA-approved protocols, reducing the burden on hospital staff and ensuring consistent outcomes. They also help mitigate liability concerns by taking on responsibility for device performance post-reprocessing. Leading companies in this space maintain sophisticated facilities and tracking systems to monitor device usage, sterilization cycles, and compliance with regulatory norms, making them a preferred choice for large healthcare institutions.
In-house reprocessing is projected to be the fastest-growing segment. This growth is fueled by larger hospitals and integrated healthcare systems seeking tighter control over inventory management and reprocessing cycles. In-house models allow immediate turnaround, cost efficiency, and better integration with hospital-specific protocols. Advances in sterilization equipment and software have made it feasible for hospitals to manage reprocessing independently without compromising safety. Moreover, rising concerns over data privacy and logistics have encouraged hospitals to invest in on-site capabilities, especially in high-use departments like cardiology and general surgery.
In the U.S., the reprocessed medical devices market is bolstered by a combination of policy support, technological advancements, and a mature healthcare infrastructure. Key regulations laid down by the U.S. FDA have paved the way for safer reprocessing practices. Furthermore, the presence of established third-party reprocessing companies and a large network of hospitals enhances the scalability of reprocessing initiatives. States such as California and New York have emerged as frontrunners in adopting sustainable healthcare practices, including reprocessing. These states have invested in green healthcare programs and have integrated environmental performance indicators into hospital evaluation metrics. In contrast, southern states are catching up with incentives offered through public-private partnerships.
Additionally, value-based care reforms are accelerating reprocessing adoption nationwide. Programs under the Centers for Medicare & Medicaid Services (CMS) promote efficiency and cost-effectiveness, indirectly encouraging reprocessing. The convergence of economic and environmental imperatives uniquely positions the U.S. to lead in global reprocessed medical device adoption.
This report forecasts revenue growth at country levels and provides an analysis of the latest industry trends in each of the sub-segments from 2021 to 2033. For this study, Nova one advisor, Inc. has segmented the U.S. reprocessed medical devices market
Product Type
Type
End-use