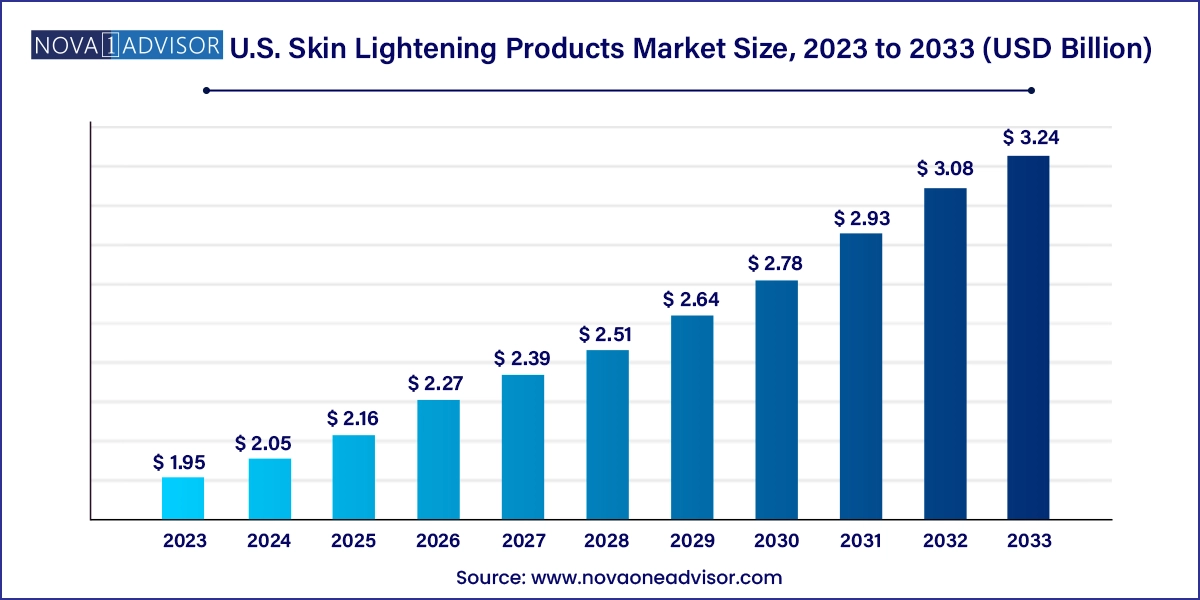
The U.S. skin lightening products market size was exhibited at USD 1.95 billion in 2023 and is projected to hit around USD 3.24 billion by 2033, growing at a CAGR of 5.2% during the forecast period 2024 to 2033.

| Report Coverage | Details |
| Market Size in 2024 | USD 2.05 Billion |
| Market Size by 2033 | USD 3.24 Billion |
| Growth Rate From 2024 to 2033 | CAGR of 5.2% |
| Base Year | 2023 |
| Forecast Period | 2024-2033 |
| Segments Covered | Product, Nature |
| Market Analysis (Terms Used) | Value (US$ Million/Billion) or (Volume/Units) |
| Country scope | U.S. |
| Key Companies Profiled | L’Oréal S.A.; Beiersdorf AG; Shiseido Co., Ltd.; Procter & Gamble; Unilever; Himalaya Global Holdings Ltd.; Avon Products, Inc.; Oriflame Cosmetics S.A.; Revlon, Inc.; The Estee Lauder Companies Inc |
The surging predisposition of consumers toward a definite solution to diverse skin issues, such as acne spot reduction or age spot, has augmented the demand of several skin lighteners in the market.
The U.S. market accounted for a share of nearly 10% of the global skin lightening products market in 2023. Skin lightening products offer numerous advantages such as decreasing pigmentation, lightening discoloration, endorsing even skin tone, and removing blemishes. The adoption of the internet across the globe has led to a surge in the number of social media users. Consequently, most of the key players in the U.S. skin lightening products market plan to endorse their products and services via social media mediums. Social media marketing is among the most vital strategies utilized by businesses and industries to create alertness of their product offerings among target customers. Thus, increasing popularity for e-commerce and digital promotion of the products are expected to assist with growth of the market during the forecast period.
There has been a notable shift in the preferences of customers regarding products comprising natural and organic ingredients. This is primarily influenced by the rising alertness regarding the possible health issues linked with specific chemical compounds used, which include mercury and hydroquinone. These are easily found in traditional skin-lightening products. In several cultures, beauty and social status are often linked with fair-skinned people. Skin-related ailments such as dark spots, hyperpigmentation, and uneven skin tone are few of the general apprehensions among customers.
The growing consumer awareness related to the adverse impacts of synthetic chemical-laden conventional products is projected to build new growth prospects for organically and naturally derived raw materials and products in the market. Organically- and naturally-cultivated products such as argan oil, aloe vera, sea kelp, and jojoba oil are few of the prime raw ingredients utilized for producing skin lightening products.
The synthetic category accounted for a revenue share of over 88% in 2023. Chemical ingredients to de-pigment the skin are extensively used in dermatology and cosmetics, which is also boosting their usage in conventional products. Few of the chemicals utilized in these products include retinoids, hydroquinone, glycolic acid, and azelaic acid. These chemical ingredients assist to increase the pace of the process of lightening due to their robust impacts on the skin. However, the extended usage of such chemicals could pose a threat to the skin health. Nevertheless, augmented research and development of new chemical compounds for skin lightening products will sustain to boost the segment across regions.
The natural skin lightening products market is anticipated to grow at a CAGR of 5.8% from 2024 to 2033, due to the increasing demand for chemical-free products. The fluctuating preference of consumers from synthetic to natural products owing to their significant advantages with zero negative effects. For example, in July 2020, Vestige unveiled Assure Natural, a vegan, cruelty-free, and natural personal care range that comprises sunscreen, day cream, lightening cream, face scrub, sleeping mask, charcoal peel-off mask, and body mask. Moreover, the surging demand for products with no adverse effects and that are paraben-free and other unsafe chemicals are projected to have a positive influence on the market.
The skin lightening creams market accounted for a share of 54.0% in 2023. Easy and effective penetration of cream in the skin attributes to its enhanced usage among users. Market players are introducing lightning creams with advanced technologies to surge their efficiency. For instance, in April 2022, Neutrogena India unveiled its New Bright Boost range of products to address the growing problem of skill dullness. The product range comprises Illuminating Serum, Resurfacing Micro Polish, and Gel Cream. The ingredient formulation states to boast a surface skin renewal procedure of 10 times, which aids in achieving a brighter, smoother, and even tone.
The skin lightening cleanser market is projected to grow at a CAGR of 5.6% from 2024 to 2033. Owing to its multi-functional benefits such as lightening discoloration, lessening pigmentation, and eliminating blemishes, all of which would further help in gaining traction among consumers. For instance, in December 2019, Astaberry Biosciences introduced a new whitening face wash for brighter and glowing skin. The product consists active natural ingredients such as mulberry and liquorice extracts, which assists in moisturizing, deep cleansing, reducing tanning, and enhancing skin complexion and texture.
This report forecasts revenue growth at country levels and provides an analysis of the latest industry trends in each of the sub-segments from 2021 to 2033. For this study, Nova one advisor, Inc. has segmented the U.S. skin lightening products market
Product
Nature