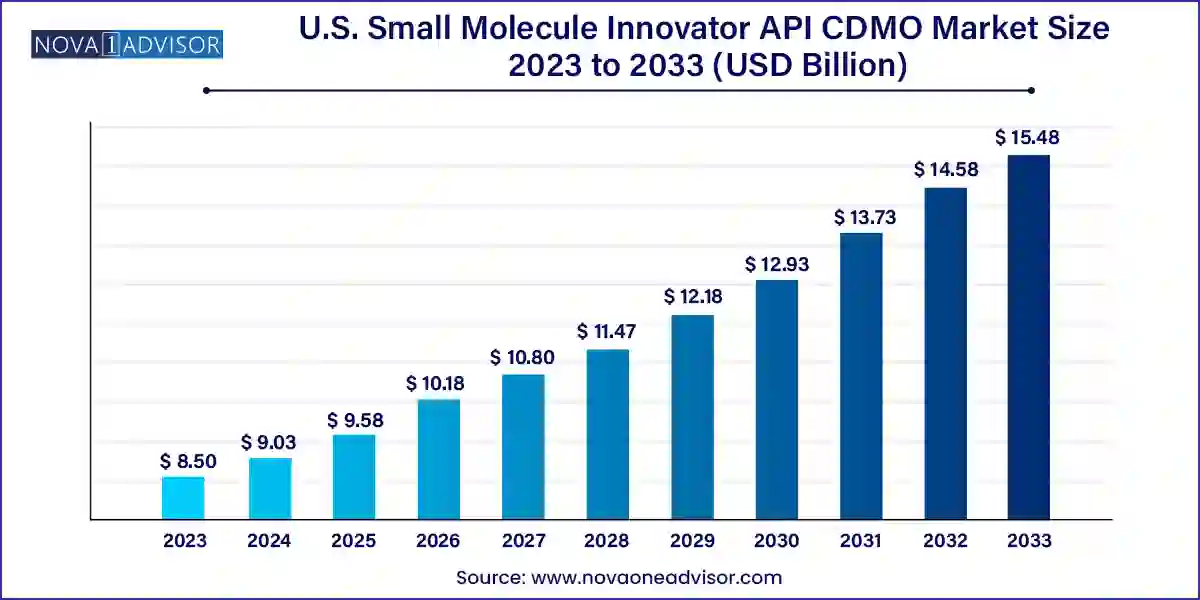
The U.S. small molecule innovator API CDMO market size was exhibited at USD 8.50 billion in 2023 and is projected to hit around USD 15.48 billion by 2033, growing at a CAGR of 6.18% during the forecast period 2024 to 2033.

The U.S. Small Molecule Innovator Active Pharmaceutical Ingredient (API) Contract Development and Manufacturing Organization (CDMO) Market plays a pivotal role in the evolving pharmaceutical value chain. As the pharmaceutical industry increasingly outsources complex API development and manufacturing tasks to third-party specialists, CDMOs have become integral partners for innovator companies seeking efficient, high-quality, and cost-effective solutions. The U.S. stands as a global hub for small molecule innovation, with a robust pipeline of novel therapeutics driven by both pharmaceutical giants and biotech startups.
Small molecules, due to their oral bioavailability, chemical stability, and relatively low production costs, continue to dominate the therapeutic landscape. Despite the rise of biologics, nearly 75% of all drugs approved by the FDA in recent years have been small molecules. This ongoing preference sustains demand for highly specialized CDMO services capable of handling increasingly complex molecules, potent APIs (HPAPIs), and compliance with ever-stringent regulatory standards.
The U.S. market, characterized by high innovation intensity, venture capital activity, and academic-industry collaboration, is particularly fertile for small molecule CDMOs. These organizations not only offer end-to-end services ranging from early-stage R&D support to commercial-scale manufacturing but also play a strategic role in accelerating time to market. Factors such as regulatory agility, patent cliff-driven outsourcing, and an increase in virtual pharma operations further fuel market expansion.
Rise of Highly Potent APIs (HPAPIs): Growing demand for oncology and central nervous system drugs has led to an increase in HPAPI projects, requiring CDMOs with specialized containment capabilities.
Shift Toward Integrated CDMO Models: Innovator companies increasingly prefer CDMOs that offer comprehensive, start-to-finish solutions encompassing discovery support, process development, and commercial manufacturing.
Surge in Preclinical Outsourcing: To reduce burn rates and accelerate discovery, startups and biotechs are outsourcing more preclinical and IND-enabling studies to CDMOs.
Adoption of Continuous Manufacturing Technologies: U.S.-based CDMOs are investing in continuous flow reactors and automation to improve scalability and reduce production timelines.
Expansion of CDMO Footprints in Emerging Hubs: States like Florida, Missouri, and Washington are attracting CDMO expansions due to favorable tax structures and growing life sciences talent pools.
Customized Solutions for Rare and Orphan Drugs: With FDA’s increasing approval of orphan drugs, CDMOs are tailoring capabilities to handle niche, low-volume but high-value projects.
Growing Strategic Partnerships and M&A Activity: Larger CDMOs are acquiring niche service providers to expand capacity and broaden technical expertise.
| Report Coverage | Details |
| Market Size in 2024 | USD 9.03 Billion |
| Market Size by 2033 | USD 15.48 Billion |
| Growth Rate From 2024 to 2033 | CAGR of 6.18% |
| Base Year | 2023 |
| Forecast Period | 2024-2033 |
| Segments Covered | Stage Type, Customer Type, Therapeutic Area, Region |
| Market Analysis (Terms Used) | Value (US$ Million/Billion) or (Volume/Units) |
| Regional Scope | Northeast; Midwest; West Group; South |
| Key Companies Profiled | Lonza Group Ltd.; Novo Holdings (Catalent, Inc.); Thermo Fisher Scientific, Inc.; Siegfried Holding AG; Recipharm AB; CordenPharma International; Samsung Biologics; Labcorp; Ajinomoto Bio-Pharma Services; Piramal Pharma Solutions; Jubilant Life Sciences (Jubilant Biosys Limited); WuXi AppTec Co., Ltd |
One of the most compelling drivers in the U.S. Small Molecule Innovator API CDMO market is the sustained expansion of novel drug pipelines, especially in oncology and rare diseases. As of recent years, small molecule drugs still constitute over half of all FDA approvals, highlighting their continued dominance. These compounds offer several advantages, including oral bioavailability, cost-effective production, and chemical versatility. Consequently, small and large pharmaceutical companies are ramping up development of such therapies.
This growing pipeline is translating into a higher demand for sophisticated API development services. Innovator companies, particularly startups and mid-sized biotechs, often lack the infrastructure to carry these molecules from lab to commercial scale. CDMOs fill this gap with expertise in process chemistry, scale-up engineering, regulatory support, and GMP manufacturing. Furthermore, as therapies become more targeted and niche, the need for agile, high-quality API production becomes even more critical, driving CDMO engagement.
Despite the market's growth potential, one key restraint is the significant capital investment required to establish and maintain advanced CDMO facilities. Developing and validating API production facilities that meet current good manufacturing practice (cGMP) standards is not only technically complex but also financially burdensome. Facilities often need specialized equipment, such as for containment of potent compounds or handling of hazardous reagents, particularly for high-potency APIs.
For newer entrants or smaller players in the CDMO space, this creates a substantial barrier to entry. Even for established companies, regular upgrades, process optimization, and compliance with evolving regulatory standards demand ongoing capital expenditure. Additionally, the lengthy lead times required for facility validation and FDA inspections can delay service provision and affect operational scalability. Thus, while demand for small molecule API CDMO services is growing, supply-side constraints related to cost and infrastructure could temper market expansion.
A major opportunity emerging in this market is the growing U.S. policy shift toward reshoring pharmaceutical manufacturing. In response to concerns about global supply chain vulnerabilities—highlighted starkly during the COVID-19 pandemic—the U.S. government has rolled out various initiatives to boost domestic drug manufacturing capabilities. These include grants, public-private partnerships, and incentives to establish API manufacturing facilities onshore.
For CDMOs operating in the innovator API segment, this policy environment offers a strategic opportunity. Innovator companies may prefer domestic CDMO partnerships to align with regulatory trends and avoid risks associated with overseas suppliers. In 2023, for instance, several companies secured federal funding to expand U.S.-based API production. This not only enhances supply chain security but also allows faster regulatory coordination with the FDA. For CDMOs, aligning with these reshoring trends could lead to long-term contracts, higher capacity utilization, and increased market share.
The commercial stage segment dominated the market in 2024, driven by long-term production contracts and the need for regulatory-compliant manufacturing. Once an innovator API receives FDA approval, the production volume surges to meet commercial demands. CDMOs play a critical role at this stage by ensuring consistent quality, scalability, and supply reliability. These partnerships often extend over multiple years, ensuring revenue stability for service providers. Given the complexity of commercial manufacturing—including regulatory inspections, batch release protocols, and supply chain coordination—pharma and biotech firms increasingly depend on CDMOs with validated infrastructure and strong quality control systems.

The fastest growing segment is Phase II clinical development, reflecting the surge in translational research and clinical trial expansion. This stage is critical for demonstrating efficacy and dosing, often requiring substantial quantities of cGMP-grade API. As venture-backed biotech firms push molecules through mid-stage trials, they look for flexible CDMO partners who can accommodate rapid scale-ups. Unlike preclinical or Phase I, Phase II trials signal a potential for future commercialization, prompting sponsors to engage more strategically with service providers. CDMOs that offer seamless transitions from development to commercial scale have a distinct advantage in capturing this growing demand.
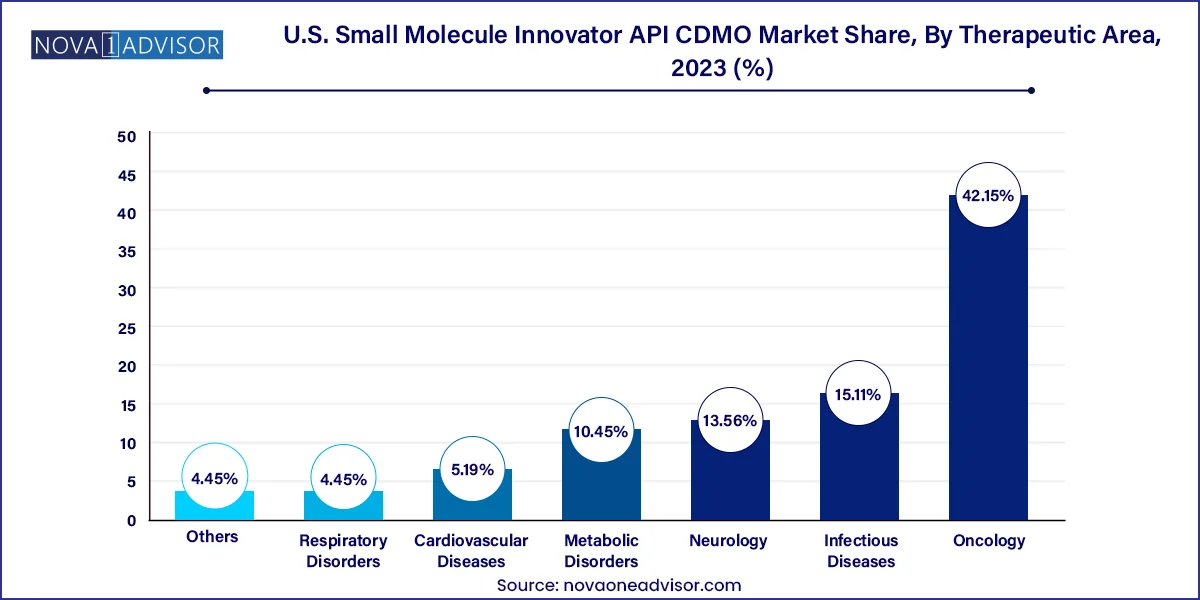
Oncology emerged as the dominant therapeutic area, accounting for the largest share of API CDMO activities. With over one-third of all new drug approvals targeting cancer indications, oncology continues to be a key focus for both pharma and biotech firms. Many cancer drugs are small molecules requiring high-potency synthesis capabilities, such as cytotoxic agents or targeted kinase inhibitors. CDMOs serving this domain must offer specialized containment facilities, process safety expertise, and the ability to produce complex molecules with precise tolerability profiles.

Meanwhile, infectious diseases is the fastest growing segment, fueled by emerging pathogen threats and continued interest in antiviral therapies. The COVID-19 pandemic renewed focus on this therapeutic domain, leading to a pipeline of innovative antivirals and treatments for conditions like influenza, RSV, and hepatitis. U.S.-based CDMOs are increasingly participating in rapid API synthesis for pandemic preparedness initiatives and emergency use authorizations. The rise of antibiotic resistance and global initiatives for new antimicrobial development are also expected to contribute to growth in this therapeutic domain.
Large pharmaceutical companies constituted the dominant customer base, contributing significantly to the overall CDMO market value. These organizations, despite having internal manufacturing facilities, increasingly outsource API production to optimize cost, enhance agility, and focus internal resources on R&D. Moreover, large pharma firms often manage extensive drug pipelines, requiring multiple parallel manufacturing programs. Their preference for U.S.-based CDMOs is also influenced by regulatory alignment, IP security, and the ability to ensure continuous supply during emergencies.
However, the fastest growing customer segment is small biotechnology companies. With limited internal manufacturing infrastructure and lean operating models, these firms are highly reliant on external partners for API development. The surge in biotech IPOs, venture capital funding, and platform-based drug discovery over the past five years has fueled this demand. Biotechs typically require high-touch, customized service, and often engage CDMOs from the early stages through commercialization. As the biotech ecosystem matures in innovation hubs like Boston, San Diego, and San Francisco, their contribution to CDMO market expansion is set to increase sharply.
The United States remains the epicenter of demand for small molecule innovator APIs, driven by the presence of leading pharmaceutical R&D centers, an advanced regulatory environment, and aggressive biopharma innovation. States such as California, Massachusetts, New Jersey, and North Carolina host numerous biotech incubators, academic research centers, and manufacturing facilities that stimulate localized demand for API services.
Notably, New Jersey and Massachusetts continue to dominate API outsourcing due to their high concentration of pharmaceutical giants and skilled workforce. In contrast, California is witnessing a surge in CDMO start-ups, especially those focused on continuous manufacturing and integrated services. Federal support programs, including those from BARDA (Biomedical Advanced Research and Development Authority), are also channeling funding toward domestic API production, directly benefitting U.S.-based CDMOs.
March 2025: Catalent announced a $250 million investment to expand its API development and manufacturing facility in Somerset, New Jersey, with a focus on small molecule and HPAPI services.
February 2025: Cambrex launched a new high-containment facility for potent API manufacturing in Charles City, Iowa, aimed at expanding its oncology-related offerings.
December 2024: Curia Global unveiled a collaboration with a Massachusetts-based biotech to provide Phase II and III API development, highlighting the rising biotech demand.
November 2024: Thermo Fisher Scientific acquired a mid-sized U.S. CDMO focused on small molecule APIs to bolster its integrated service model.
October 2024: Pfizer partnered with a U.S. CDMO for domestic manufacturing of APIs for its anti-infective pipeline, under a strategic reshoring initiative supported by the federal government.
This report forecasts revenue growth at country levels and provides an analysis of the latest industry trends in each of the sub-segments from 2021 to 2033. For this study, Nova one advisor, Inc. has segmented the U.S. small molecule innovator API CDMO market
Stage Type
Customer Type
Therapeutic Area
Regional