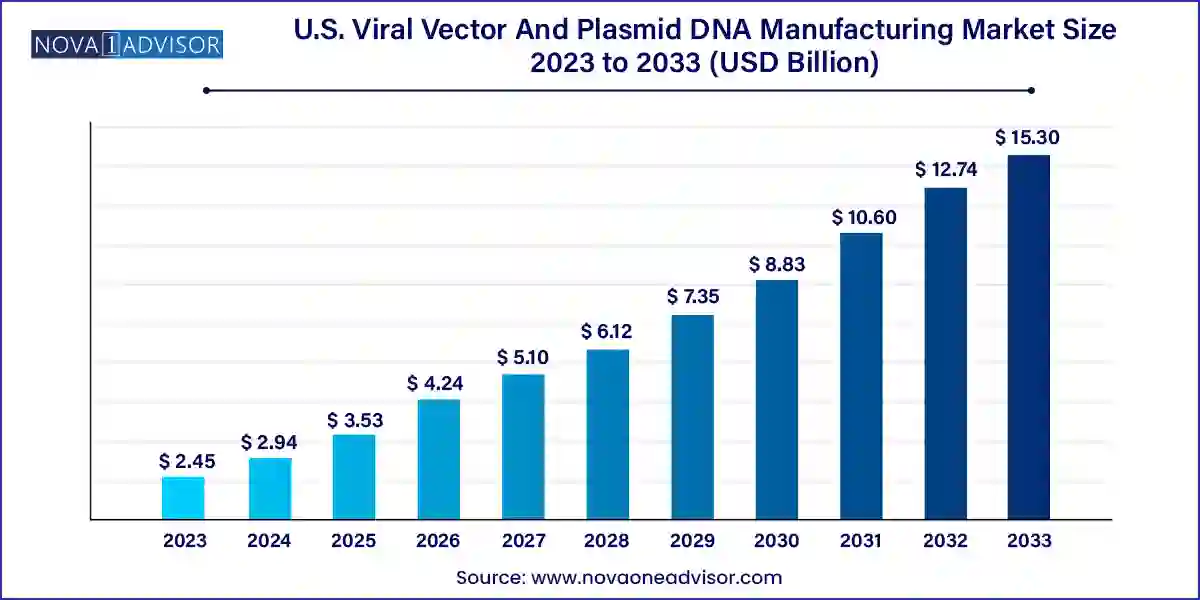
The U.S. viral vector and plasmid DNA manufacturing market size was valued at USD 2.45 billion in 2023 and is expected to be worth around USD 15.30 billion by 2033, with a registered CAGR of 20.1% during forecast period 2024 to 2033.

The U.S. viral vector and plasmid DNA manufacturing market is a critical backbone of the rapidly evolving fields of gene therapy, cell therapy, RNA-based therapeutics, and modern vaccinology. Viral vectors and plasmid DNA serve as the foundational components required for the delivery and expression of therapeutic genes, vaccines, and genetic materials. As the country pushes forward in biomedical innovation and personalized medicine, these components are increasingly in demand for both clinical and commercial applications.
The advent of advanced therapy medicinal products (ATMPs) has dramatically increased the reliance on robust, scalable, and compliant manufacturing platforms for gene delivery systems. Viral vectors, such as adeno-associated viruses (AAV), lentiviruses, and adenoviruses, are the most widely used tools for delivering genetic payloads into cells. Meanwhile, plasmid DNA plays a crucial upstream role in generating these viral vectors and serves as a direct therapeutic modality in DNA vaccines and gene therapies.
In the United States, which hosts the largest biotechnology ecosystem globally, the need for scalable and flexible manufacturing of these components is at an all-time high. Biopharmaceutical companies are expanding clinical pipelines for rare genetic disorders, cancers, and infectious diseases, all of which require high-quality viral vectors and plasmids. However, most sponsors lack in-house infrastructure and expertise to meet the rigorous standards of GMP production, making contract manufacturing organizations (CMOs and CDMOs) essential players in the ecosystem.
Government initiatives to reshore manufacturing, increased venture capital funding in gene therapy startups, and fast-track regulatory approvals for breakthrough therapies are all converging to fuel sustained growth in the market. This environment has not only encouraged facility expansions but also fostered new technology platforms, automation, and digital QA/QC systems aimed at streamlining production.
Growing preference for AAV and lentiviral vectors in gene and cell therapy trials due to their safety profile and efficiency.
Increase in demand for GMP-grade plasmid DNA as a key upstream material for viral vector production and DNA vaccines.
Expansion of manufacturing capacity through facility investments and public-private partnerships to mitigate vector supply shortages.
Technological advancements in vector purification and cell culture platforms to improve yield and reduce costs.
Rise in viral vector outsourcing among biotech startups and mid-sized companies lacking internal manufacturing capability.
Integration of single-use bioreactor systems and modular production units to boost flexibility and reduce contamination risk.
Emergence of AI and automation in quality control, documentation, and process monitoring across GMP manufacturing workflows.
Increased focus on scalability and standardization as more gene therapies transition from clinical trials to commercialization.
U.S. Viral Vector And Plasmid DNA Manufacturing Market Report Scope
| Report Attribute | Details |
| Market Size in 2024 | USD 2.94 Billion |
| Market Size by 2033 | USD 15.30 Billion |
| Growth Rate From 2024 to 2033 | CAGR of 20.1% |
| Base Year | 2023 |
| Forecast Period | 2024 to 2033 |
| Segments Covered | Vector type, workflow, application, end-use, disease |
| Market Analysis (Terms Used) | Value (US$ Million/Billion) or (Volume/Units) |
| Report Coverage | Revenue forecast, company ranking, competitive landscape, growth factors, and trends |
| Key Companies Profiled | Thermo Fisher Scientific, Inc.; Catalent Inc.; Waisman Biomanufacturing; Genezen; Revvity (SIRION Biotech); BioMarin; Virovek Incorporation; Charles River Laboratories (Cobra Biologics); RegenxBio, Inc. |
Adeno-associated viruses (AAVs) dominated the vector type segment in 2024, driven by their strong clinical track record in gene therapy. AAVs are widely used due to their low immunogenicity, ability to infect both dividing and non-dividing cells, and long-term expression in vivo. Several FDA-approved gene therapies, including Zolgensma and Luxturna, use AAVs as delivery vehicles. Given this success, most gene therapy programs in the U.S. are designed around AAVs, leading to an overwhelming demand for contract manufacturing of these vectors.
Lentiviral vectors are the fastest-growing segment due to their essential role in cell-based immunotherapies such as CAR-T therapies. These vectors can integrate into the host genome, offering durable expression of therapeutic genes—a feature highly valued in oncology. The launch and success of CAR-T therapies like Yescarta and Kymriah have validated lentiviral platforms, prompting a surge in clinical trials and associated manufacturing needs. As the next generation of engineered cell therapies expands into autoimmune diseases and solid tumors, demand for lentiviral vector production is projected to grow even faster.
Upstream manufacturing specifically vector amplification and expansion dominated the workflow segment in 2024 due to its critical role in determining overall yield. This phase includes cell culture, transfection, and virus production steps, all of which require optimization to ensure adequate quantities for downstream processing. CDMOs with expertise in cell line development, high-density cell culture systems, and media optimization hold competitive advantages in this area.
However, fill-finish emerged as the fastest-growing segment, reflecting the industry's shift toward commercialization. As more gene therapies progress into late-phase trials and enter the market, the need for sterile, GMP-compliant fill-finish operations has surged. This final step is crucial in ensuring product stability, shelf life, and patient safety. Investments in automated fill-finish suites, isolators, and single-use systems are now priorities for both in-house biomanufacturers and CDMOs aiming to offer full-spectrum services.
Gene therapy was the leading application segment in 2024, accounting for the largest share due to the increasing number of clinical trials and regulatory approvals. The U.S. hosts the majority of global gene therapy programs, particularly for rare diseases such as Duchenne muscular dystrophy, hemophilia, and inherited retinal disorders. These therapies require large volumes of viral vectors and GMP-grade plasmid DNA, often supplied by contract manufacturers with experience in niche regulatory pathways.
Vaccinology is the fastest-growing application, catalyzed by the success of nucleic acid vaccines and the rise of pandemic preparedness initiatives. DNA and viral vector-based vaccines have shown promise beyond COVID-19, including candidates for Zika, HIV, and even certain cancers. Government-backed contracts and public-private collaborations are fueling rapid expansion in this area, encouraging CDMOs to scale up vector and plasmid production specifically for vaccine developers.
Pharmaceutical and biopharmaceutical companies led the end-use segment in 2024, being the primary drivers of innovation and product development. These entities often lack the internal infrastructure to handle GMP-grade vector production and therefore partner with CDMOs for scale-up, quality assurance, and regulatory support. Many biotech firms are entering long-term supply agreements or strategic partnerships to secure vector access ahead of commercial launch.
Research institutes are the fastest-growing end-user group, supported by increased NIH funding and public investment in gene editing, immunotherapy, and vaccine discovery. Academic centers and non-profit research hospitals are conducting more translational and early-phase clinical studies, which require research-grade plasmids and viral vectors. With time-sensitive objectives and limited internal capacity, many of these institutions rely on contract manufacturers for pilot production and early GMP compliance support.
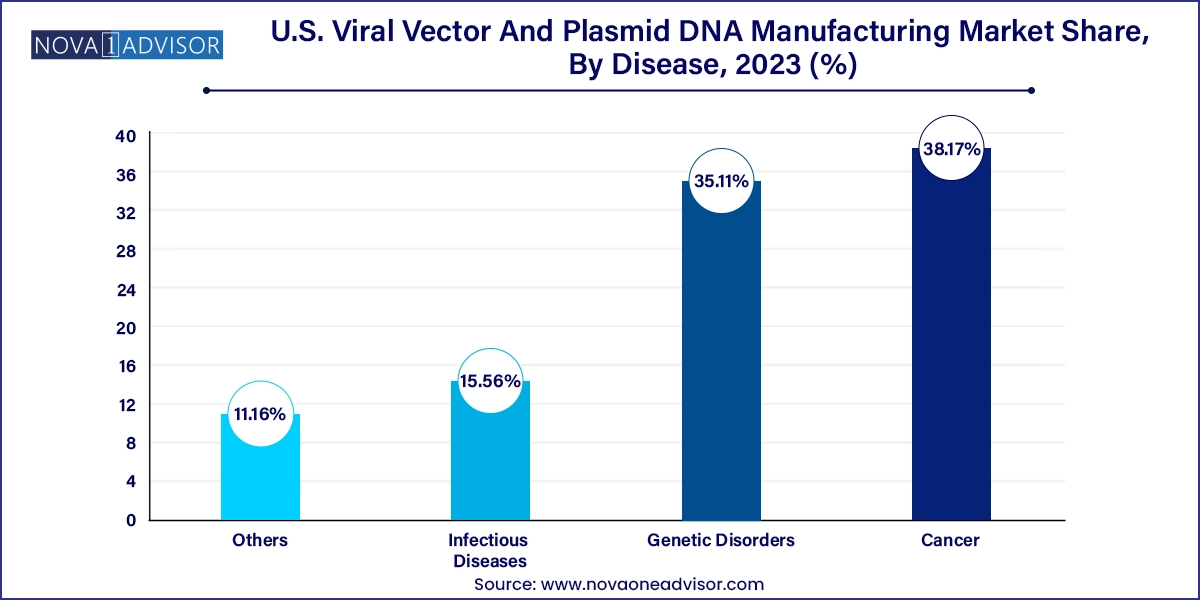
Cancer was the dominant disease area, reflecting the use of viral vectors and plasmids in immuno-oncology, CAR-T therapies, and tumor vaccine development. The FDA has approved several cancer gene therapies in recent years, and over half of the active gene therapy trials in the U.S. target oncology indications. These therapies often require complex manufacturing setups, including multi-plasmid workflows and vector customization, making them ideal candidates for outsourcing.

Genetic disorders, particularly rare monogenic diseases, are the fastest-growing area as more therapies receive orphan drug designations. With personalized treatment models and breakthrough designations by the FDA, gene therapies for conditions like spinal muscular atrophy, hemophilia, and retinal dystrophies are advancing rapidly. These therapies often rely on high-dose AAV vectors and plasmid precursors, making timely and scalable contract manufacturing essential for success.
The United States serves as the global epicenter for viral vector and plasmid DNA manufacturing, thanks to its mature biopharma landscape, advanced research institutions, and robust regulatory infrastructure. Regions such as Massachusetts, California, North Carolina, and Maryland are hubs for biotech innovation, hosting both large-scale manufacturers and startup CDMOs. These regions benefit from proximity to universities, skilled talent pools, and government funding agencies.
The U.S. Department of Health and Human Services (HHS), BARDA, and NIH continue to invest in the development of domestic biomanufacturing capacity, particularly for pandemic preparedness and rare disease therapies. These efforts are bolstered by favorable FDA frameworks that support accelerated approval, fast-track designation, and priority review for gene and cell therapies. With increasing emphasis on domestic production security, more biopharma companies are choosing U.S.-based CDMOs as long-term partners for viral vector and plasmid manufacturing.
March 2025 – Thermo Fisher Scientific expanded its Lexington, Massachusetts site to include large-scale viral vector manufacturing capabilities, adding 100,000 sq ft of GMP production space.
February 2025 – Vigene Biosciences (Charles River Laboratories) announced a partnership with a leading oncology biotech for long-term lentiviral vector manufacturing under exclusive supply terms.
January 2025 – Aldevron, a Danaher company, opened a new plasmid DNA facility in North Carolina aimed at supporting Phase III and commercial-scale vector programs.
December 2024 – Catalent Inc. launched an integrated viral vector platform combining plasmid production, vector generation, purification, and fill-finish under one roof in Harmans, Maryland.
November 2024 – Andelyn Biosciences unveiled a digital manufacturing initiative for real-time tracking and QA of vector production batches, enhancing transparency for sponsor clients.
This report forecasts revenue growth at country levels and provides an analysis of the latest industry trends in each of the sub-segments from 2021 to 2033. For this study, Nova one advisor, Inc. has segmented the U.S. Viral Vector And Plasmid DNA Manufacturing market.
By Vector Type
By Workflow
By Application
By End-use
By Disease