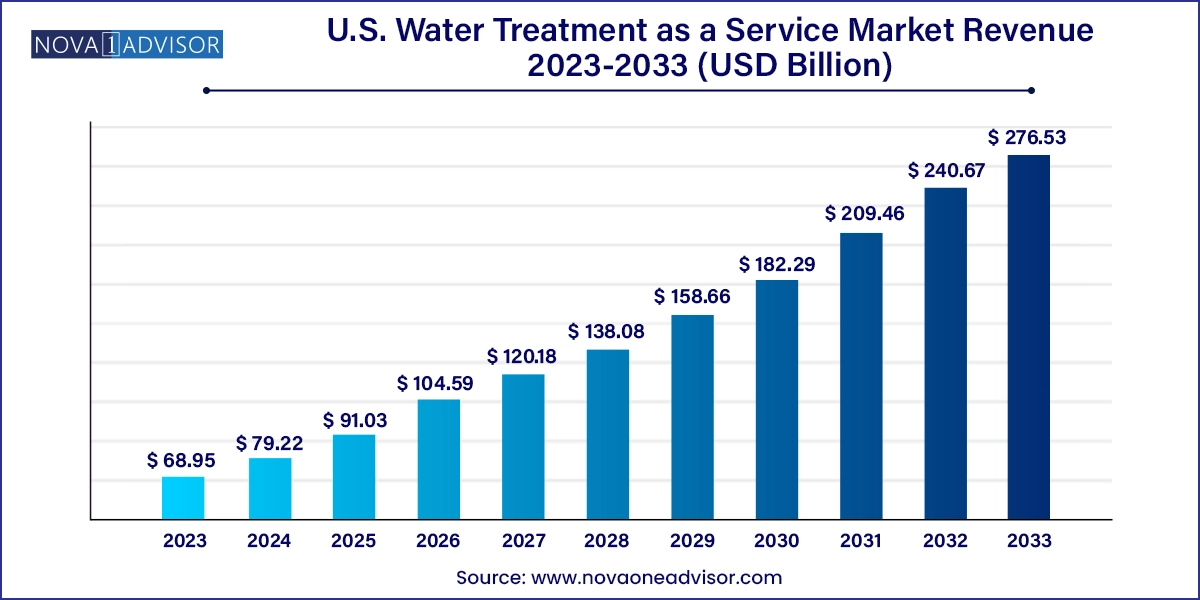
The U.S. water treatment as a service market size was exhibited at USD 68.95 million in 2023 and is projected to hit around USD 276.53 million by 2033, growing at a CAGR of 14.9% during the forecast period 2024 to 2033.

The U.S. Water Treatment as a Service (WTaaS) Market is evolving as a transformative solution to modern water management challenges across residential, commercial, and industrial sectors. Unlike traditional models, WTaaS shifts the burden of water purification, filtration, and compliance from capital-intensive ownership to an outsourced, service-based structure. This flexible, pay-as-you-go or subscription-based model enables end-users to access cutting-edge water treatment technologies without large upfront investments, ensuring scalability, convenience, and real-time monitoring capabilities.
This paradigm shift comes in response to growing concerns over water contamination, aging municipal infrastructure, and increasing regulatory scrutiny from the Environmental Protection Agency (EPA) and state-level environmental authorities. Additionally, climate variability, rising demand from growing urban populations, and infrastructure stress in states like Florida, Georgia, North Carolina, and South Carolina have necessitated more adaptive and cost-effective water treatment solutions.
Water Treatment as a Service supports advanced purification using systems such as reverse osmosis (RO), UV disinfection, smart filtration, and ion exchange, tailored to each customer's usage pattern and water quality. In the U.S., both small residential complexes and large commercial enterprises including hospitality chains, cruise lines, universities, and office parks—are adopting WTaaS to reduce maintenance overhead, ensure compliance, and access real-time water quality data.
As sustainability and water efficiency become mission-critical, WTaaS is rapidly gaining traction, transforming water management into a subscription-driven utility with data-driven optimization, performance-based contracts, and IoT-enabled visibility.
Growth of Subscription-Based Water Treatment Services: Businesses and residential communities prefer predictable monthly service models that include maintenance, monitoring, and filter replacement.
Smart Water Monitoring and Remote Diagnostics: IoT-enabled water treatment systems provide real-time insights into water quality, usage, and system performance.
Rising Demand in Hospitality and Cruise Ship Sectors: Water quality is paramount for guest experience, prompting resorts, cruise lines, and hotels to outsource water treatment.
Regulatory Compliance Driving Commercial Adoption: Stricter water discharge and purification standards from the EPA are pushing businesses toward WTaaS models for seamless compliance.
Integration of Renewable-Powered Treatment Units: Solar-powered disinfection and battery-backed RO systems are emerging in remote or off-grid locations, especially in Florida and coastal regions.
Increased Customization of Water Treatment Solutions: WTaaS providers are offering modular, tailored systems for different user segments—from retail outlets to universities.
Rising Popularity of Compact Point-of-Use Systems for Residences: Homeowners are turning to compact subscription-based softeners and RO systems to improve tap water quality and taste.
| Report Coverage | Details |
| Market Size in 2024 | USD 79.22 Million |
| Market Size by 2033 | USD 276.53 Million |
| Growth Rate From 2024 to 2033 | CAGR of 14.9% |
| Base Year | 2023 |
| Forecast Period | 2024-2033 |
| Segments Covered | End-use, Technology, Model, Region |
| Market Analysis (Terms Used) | Value (US$ Million/Billion) or (Volume/Units) |
| Country scope | Florida; Georgia; South Carolina; North Carolina |
| Key Companies Profiled | Seven Seas Water Group; Waterleau; Oneka Technologies; Clearford Water Systems; Quench USA, Inc.; Chart Industries; OriginClear; Aquatech International LLC.; Bawat Water Technologies AB |
A core driver of the WTaaS market in the U.S. is the nation's deteriorating water infrastructure and rising public concern over water quality and safety. According to the American Society of Civil Engineers, much of the U.S. water infrastructure particularly in the southeastern states is over 50 years old, leading to frequent pipe bursts, contamination events, and inconsistent water quality. This has triggered public scrutiny and forced many municipalities and businesses to seek reliable, real-time water treatment alternatives.
For instance, the Flint water crisis and other high-profile contamination events have raised awareness and consumer demand for higher water standards even in residential zones with regulated utility water. Businesses in the commercial sector are also highly sensitive to water quality since it directly impacts health regulations, customer satisfaction, and equipment longevity.
WTaaS solutions offer a responsive and proactive model where providers handle end-to-end treatment, maintenance, and compliance monitoring. This model is particularly attractive in states like Florida and Georgia, where heavy tourism, seasonal demand surges, and saltwater intrusion create added water quality risks. For small businesses and multi-tenant buildings, WTaaS offers a smart and agile way to address these challenges without capital expenditure.
Despite its advantages, WTaaS faces a key restraint in the form of consumer hesitation toward long-term service contracts and lack of transparency in pricing and service deliverables. Many potential users especially in the residential and small commercial space are wary of subscribing to a monthly utility that lacks perceived control or customization. Unlike owning a filtration unit, service-based models may raise concerns about system reliability, downtime, and long-term cost escalation.
Furthermore, some WTaaS providers offer multi-year binding contracts, which can deter adoption in lease-based commercial properties or for seasonal businesses, like vacation rentals and cruise lines, that operate on variable occupancy and require high flexibility. Additionally, understanding of smart water systems and digital monitoring among average consumers remains low, further slowing adoption rates.
To address these challenges, market players need to invest in consumer education, develop trial-based onboarding models, and offer clear SLAs (Service-Level Agreements) that ensure performance guarantees and simple exit terms.
A significant opportunity for the U.S. WTaaS market lies in the growing push for green infrastructure and ESG (Environmental, Social, Governance) reporting among corporations and property developers. As water becomes a core element of sustainable design and facility operations, there is rising demand for systems that enable efficient, compliant, and documented water treatment, without the burden of ownership.
In commercial real estate, educational institutions, and government campuses, WTaaS can help achieve LEED certification goals, water reuse compliance, and support real-time reporting of water usage and waste reduction, aligned with ESG metrics. For companies seeking carbon neutrality and sustainable operations, subscribing to water treatment solutions that offer low-energy disinfection, membrane reuse, or waste recycling options can become a competitive advantage.
Real estate developers and facilities managers are increasingly integrating WTaaS contracts into smart building management platforms, enabling centralized monitoring and predictive maintenance. This opportunity is further amplified by state-level water efficiency incentives, especially in drought-prone areas like Florida and South Carolina, where water availability is a concern year-round.
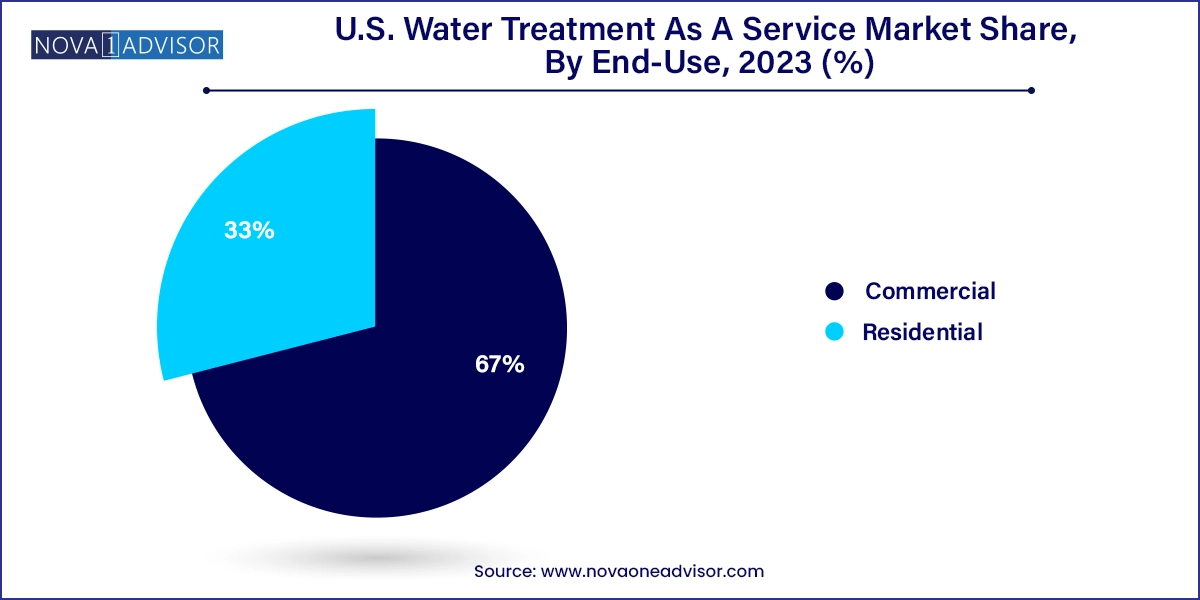
The commercial segment dominated the U.S. WTaaS market, largely due to its diverse and intensive water usage patterns, ranging from hospitality and office buildings to cruise ships and universities. Water treatment is mission-critical for these establishments—not only for compliance, but also for brand reputation, guest satisfaction, and operational continuity. In hospitality, for example, water used in pools, showers, and kitchens must meet stringent safety standards, prompting large hotel chains and cruise lines to opt for turnkey WTaaS models that include remote monitoring and automated filter replacement. Additionally, universities and corporate campuses benefit from centralized systems that support large-scale water recycling, HVAC system conditioning, and drinking water purification.

The residential segment is the fastest-growing, supported by the rise in homeowner awareness, particularly in the wake of water contamination scares and increased emphasis on indoor health. Suburban and urban households across the Southeast are adopting compact, subscription-based water filtration and softening systems, often bundled with smart home integrations. WTaaS providers are targeting this market with app-controlled, under-sink systems and pay-as-you-go water treatment plans, offering professional-grade quality with zero installation burden.
The subscription model is the dominant model, with predictable monthly fees, full-service maintenance, and customer support. Businesses prefer this model due to budgeting convenience, vendor accountability, and equipment upgrades included in the plan. Companies offering tiered subscription levels based on flow rate, usage volume, and filter type are finding success with small and medium-sized enterprises (SMEs), retail chains, and residential communities.
The pay-as-you-go model is gaining popularity, especially among short-term renters, mobile business owners, and seasonal properties, such as beachside resorts or RV parks. These users benefit from flexible billing and usage-based pricing, avoiding overcapacity or long-term obligations. This model is also used in emergency and disaster relief scenarios, where water treatment is required temporarily and urgently.
Filtration systems held the leading market share, due to their versatility and applicability across both residential and commercial setups. These systems, which include activated carbon, sediment filters, and hybrid media, effectively reduce turbidity, odor, heavy metals, and chlorine levels, making them ideal for everyday use. They are also the most common entry point for customers shifting to service-based models. In retail outlets and office complexes, filtration systems are integrated into point-of-use dispensers, water fountains, and kitchen units, where performance and aesthetics are critical.
Reverse Osmosis (RO) systems are the fastest-growing, particularly among high-end residences, healthcare facilities, and restaurants that demand multi-stage purification to eliminate dissolved solids, fluoride, bacteria, and viruses. RO systems, now designed to be more compact and water-efficient, are increasingly available through monthly rental or performance-based models, enabling users to upgrade without capital costs. RO is especially popular in Florida and Georgia, where concerns over hard water, lead contamination, and mineral content are prevalent.
Florida is a hotbed of demand, especially in hospitality, cruise, and residential real estate. WTaaS providers offer saltwater conditioning, RO for high TDS levels, and filtration systems to combat pesticide runoff in suburban zones. Miami, Orlando, and Tampa are growth centers, driven by high-rise development and eco-friendly building trends.
Georgia is seeing strong adoption in commercial buildings and universities, particularly in Atlanta. Large campuses are shifting to centralized WTaaS systems, driven by student health concerns and sustainability reporting requirements.
North Carolina and South Carolina offer a mix of residential demand and commercial expansion, with Raleigh-Durham and Charleston focusing on water conservation amid rapid urbanization. Tourist-heavy coastal zones are deploying WTaaS systems in boutique hotels and retirement communities, often as part of green building certifications.
This report forecasts revenue growth at country levels and provides an analysis of the latest industry trends in each of the sub-segments from 2021 to 2033. For this study, Nova one advisor, Inc. has segmented the U.S. water treatment as a service market
End-Use
Technology
Model
Regional