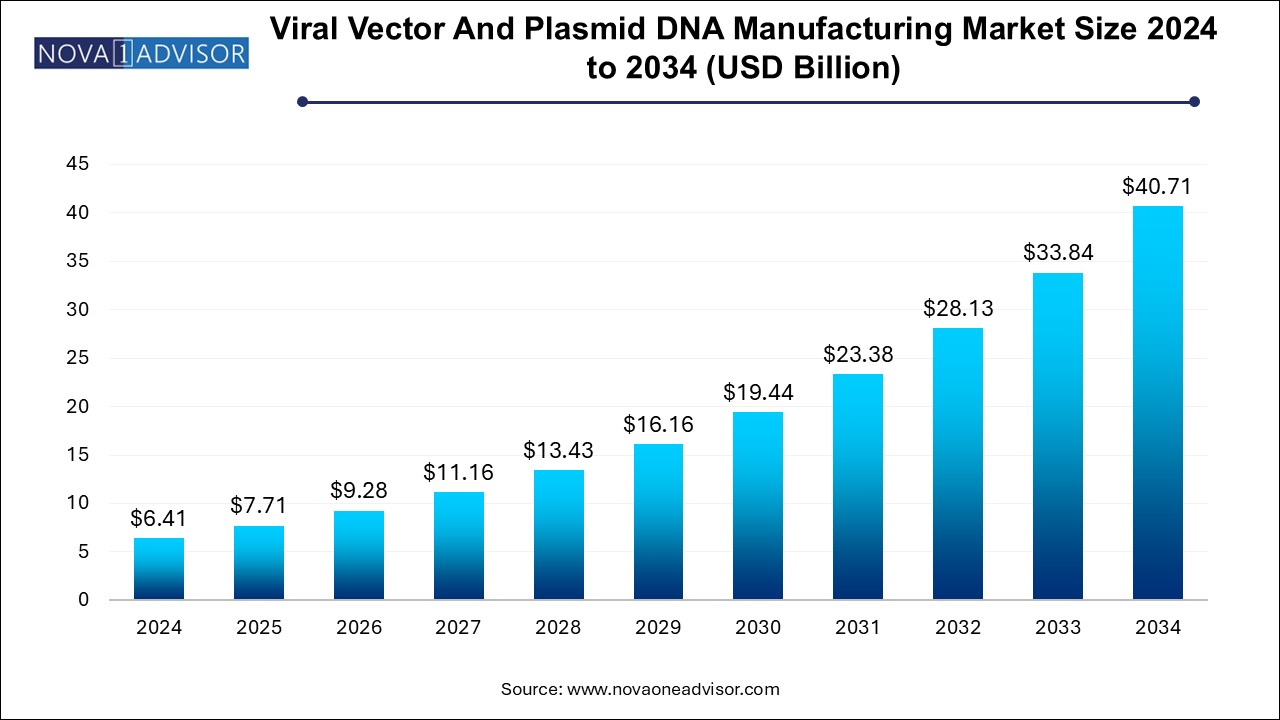
The viral vector and plasmid DNA manufacturing market size was exhibited at USD 6.41 billion in 2024 and is projected to hit around USD 40.71 billion by 2034, growing at a CAGR of 20.3% during the forecast period 2025 to 2034.

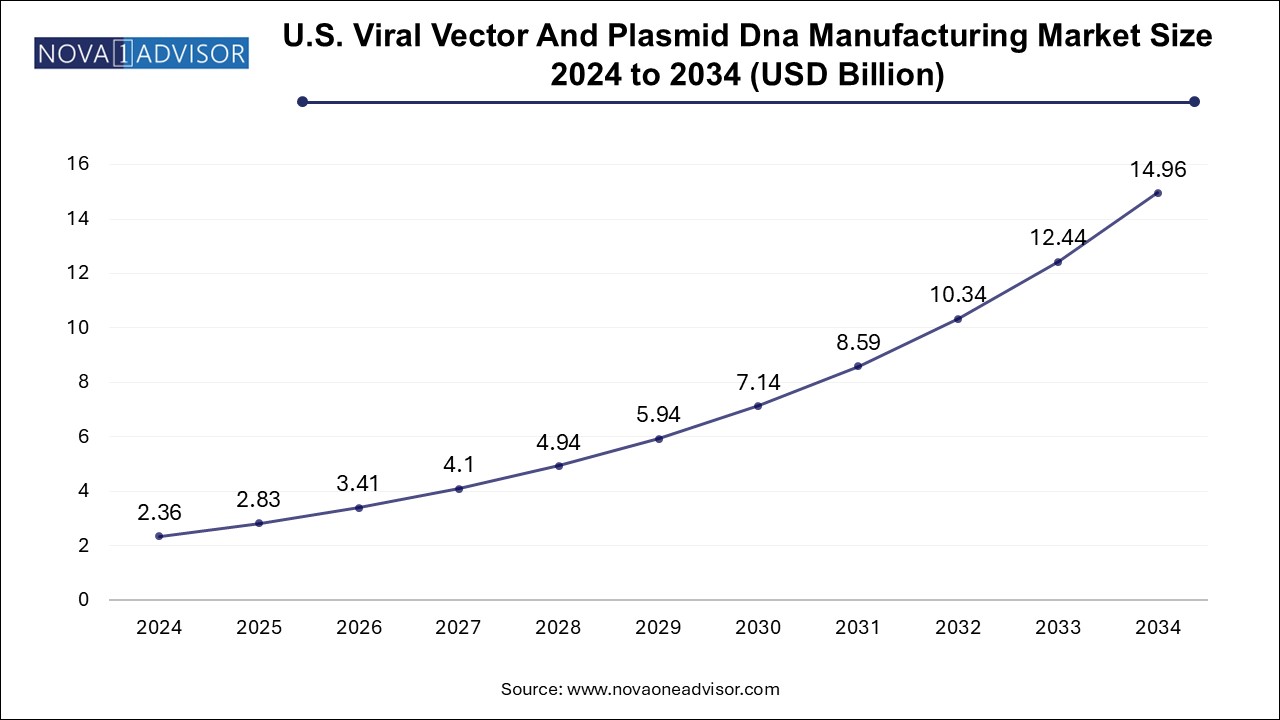
The U.S. viral vector and plasmid DNA manufacturing market size is evaluated at USD 2.36 billion in 2024 and is projected to be worth around USD 14.96 billion by 2034, growing at a CAGR of 18.27% from 2025 to 2034.

North America accounted for the largest share in 2024, supported by a robust biotech ecosystem, regulatory clarity, and the presence of leading gene therapy developers. The U.S. houses top CDMOs, including Thermo Fisher, Catalent, and Charles River, along with leading biotech hubs like Boston, San Diego, and the Bay Area. FDA support through accelerated pathways for advanced therapies has stimulated investment in vector production infrastructure.
The region also witnessed significant pandemic-era investments in vaccine production capacity, including mRNA and adenoviral platforms, laying the foundation for long-term plasmid and viral vector supply chain optimization.
Asia Pacific is projected to grow fastest, driven by expanding clinical trial activity, domestic biotech innovation, and supportive government initiatives. Countries like China, Japan, and South Korea are building national gene therapy programs and investing in biomanufacturing parks. India's strength in plasmid and vaccine manufacturing, coupled with increasing regulatory alignment, is also contributing to regional growth.
Regional CDMOs are entering strategic collaborations with global pharma firms, and local demand for gene therapy in rare diseases and oncology is creating market pull. The APAC region's cost advantages, skilled workforce, and technology transfers make it a strategic manufacturing hub.
The viral vector and plasmid DNA manufacturing market plays a pivotal role in the broader fields of gene therapy, cell-based therapies, and nucleic acid-based vaccines. As the biotech industry continues to transition from small-molecule therapeutics to highly personalized and targeted treatment modalities, the need for robust, scalable, and compliant vector and plasmid manufacturing solutions has surged dramatically.
Viral vectors—including lentiviruses, adeno-associated viruses (AAV), retroviruses, and adenoviruses—are commonly used delivery vehicles to introduce genetic material into cells. In parallel, plasmid DNA serves as a fundamental raw material in the development of viral vectors, vaccines, and gene editing platforms like CRISPR. Both platforms are indispensable in the production of advanced therapies such as CAR-T, mRNA-based vaccines, and gene silencing treatments.
The rapid development and approval of cell and gene therapies, particularly in oncology, rare genetic diseases, and infectious diseases, have led to increasing commercial demand for high-yield, GMP-compliant viral vectors and plasmid DNA. In the wake of the COVID-19 pandemic, the market saw accelerated growth driven by viral vector-based vaccine platforms and large-scale plasmid DNA production. As the post-pandemic focus shifts toward non-infectious applications like genetic disorders and immunotherapies, the demand is expected to remain high and evolve further.
Currently, one of the key challenges in the field is the production bottleneck. Manufacturing constraints such as batch scalability, cost-intensive purification processes, and regulatory compliance complexities have led several biotech firms to outsource vector and plasmid manufacturing to specialized contract development and manufacturing organizations (CDMOs). Additionally, investments in continuous manufacturing, automation, and next-generation purification techniques are transforming the production landscape.
The market is poised for substantial growth over the next decade as R&D pipelines expand, regulatory frameworks evolve, and large-scale clinical successes validate the therapeutic efficacy of gene-modifying platforms.
Rise of Cell and Gene Therapies: Demand for lentiviral and AAV vectors is increasing to support pipelines of gene-modified cell therapies and gene therapies.
Plasmid DNA as a Core Manufacturing Intermediate: Plasmids are being used not only as templates for mRNA and vector production but also as therapeutics in DNA vaccines.
Shift Toward In-House Manufacturing by Big Pharma: While CDMOs dominate, large biopharma companies are building internal vector production capacity to reduce dependency.
Integration of Single-use and Modular Bioprocessing Systems: Manufacturers are adopting scalable, disposable bioreactor systems for faster production turnaround.
Increased FDA Scrutiny and GMP Requirements: Regulatory authorities are imposing stricter compliance protocols, particularly in viral vector quality control and release testing.
Upstream Bottlenecks Driving Tech Innovation: Innovation is focused on improving cell line productivity, vector amplification, and harvesting efficiency.
Emergence of Non-viral Delivery Platforms: Plasmid DNA is enabling non-viral gene delivery systems, reducing immunogenic risks in certain therapies.
Growth in Hybrid Outsourcing Models: Strategic partnerships between biotech firms and CDMOs are shifting from transactional to long-term collaborative engagements.
| Report Coverage | Details |
| Market Size in 2025 | USD 7.71 Billion |
| Market Size by 2034 | USD 40.71 Billion |
| Growth Rate From 2025 to 2034 | CAGR of 20.3% |
| Base Year | 2024 |
| Forecast Period | 2025-2034 |
| Segments Covered | Vector Type, Workflow, Application, End-use, Disease, Region |
| Market Analysis (Terms Used) | Value (US$ Million/Billion) or (Volume/Units) |
| Regional scope | North America; Europe; Asia Pacific; Latin America; MEA |
| Key Companies Profiled | Merck KGaA, Lonza; FUJIFILM Diosynth Biotechnologies; Thermo Fisher Scientific; Cobra Biologics; Catalent Inc.; Wuxi Biologics; TakarBio Inc.; Waisman Biomanufacturing; Genezen laboratories; Batavia Biosciences; Miltenyi Biotec GmbH; SIRION Biotech GmbH; Virovek Incorporation; BioNTech IMFS GmbH; Audentes Therapeutics; BioMarin Pharmaceutical; RegenxBio, Inc. |
The single most influential driver of the viral vector and plasmid DNA manufacturing market is the explosive growth in gene and cell therapy development pipelines. According to global regulatory bodies and trade groups, there are currently over 2,000 active clinical trials globally involving gene and cell therapies, with viral vectors and plasmid DNA forming the backbone of these platforms. This surge is fueled by the success of commercialized gene therapies like Zolgensma and CAR-T cell therapies like Yescarta and Kymriah.
Each therapy requires large-scale and highly specific vector batches or plasmids, sometimes tailored to individual patients (as in autologous therapies). The move toward personalized medicine is intensifying demand, not only in terms of volume but also in production customization. Companies that were once focused solely on R&D now find themselves facing commercial manufacturing challenges, resulting in outsourcing partnerships or investment in in-house biomanufacturing capabilities.
As regulatory approvals increase, particularly in oncology and rare genetic disorders, the pressure on manufacturing ecosystems will continue to mount—propelling market demand for advanced, high-purity viral vectors and plasmids.
Despite high growth, the market faces significant constraints in manufacturing capacity, scalability, and cost efficiency. Viral vector production is inherently complex, often involving transient transfection of mammalian cells, lengthy purification processes, and low-yield recovery. This leads to long production cycles, expensive cleanroom requirements, and batch-to-batch variability—limiting commercial scalability.
In addition, purification steps, particularly for AAV and lentiviral vectors, require sophisticated chromatography and filtration techniques, which are resource-intensive and time-consuming. For plasmid DNA, ensuring endotoxin-free and GMP-grade output at scale remains a manufacturing and cost challenge.
These barriers not only increase costs but also delay time-to-market, particularly for smaller biotech companies. Additionally, the high failure rate of vector batches and limited supplier base contribute to supply-chain risks. As regulatory expectations tighten around batch release testing, quality control, and process validation, manufacturers must navigate an increasingly intricate compliance environment.
A compelling opportunity lies in the innovation of upstream and downstream bioprocessing technologies that can improve yield, lower costs, and accelerate scalability. In upstream manufacturing, the use of suspension cell cultures, stable producer cell lines, and perfusion bioreactors is enabling higher titers and continuous production capabilities.
In downstream purification, novel methods such as affinity chromatography, tangential flow filtration (TFF), and membrane-based purification are significantly improving purity and recovery while reducing time and footprint. Moreover, automation, real-time analytics, and PAT (Process Analytical Technology) tools are optimizing batch consistency and quality control.
The growing interest in continuous manufacturing and modular cleanroom systems allows CDMOs and biopharma companies to rapidly deploy flexible, scalable facilities. These innovations are expected to not only reduce the cost of viral vector and plasmid DNA production but also improve regulatory compliance and speed to market—especially for therapies in expedited review programs.
Plasmids dominated the market in 2024, driven by their essential role in the production of viral vectors, mRNA-based vaccines, and non-viral gene delivery platforms. Plasmid DNA is also being used directly as the active pharmaceutical ingredient (API) in DNA-based vaccines and therapies. Its applications in gene editing and RNAi platforms, along with the rise of CRISPR-Cas9 technologies, have amplified demand. High-growth areas include DNA plasmids for cancer vaccines, rare diseases, and antimicrobial resistance solutions.
Adeno-associated viruses (AAVs) are the fastest-growing vector type, owing to their non-pathogenic nature, high transduction efficiency, and strong presence in late-stage gene therapy trials. AAV vectors are widely used for neurological and muscular disorders. Their rising use in in vivo gene delivery platforms, combined with high-dose requirements, make scalable AAV production a focus for biotech firms and CDMOs alike.
Upstream manufacturing accounted for the larger share, particularly due to the complexity and cost-intensive nature of vector amplification and expansion. In upstream processing, achieving high-yield expression systems, transfection efficiency, and scalable culture conditions are key technical challenges. Companies investing in suspension cell systems and stable packaging lines are gaining competitive advantages.
Downstream manufacturing is projected to witness faster growth, especially in the purification and fill-finish stages. As regulatory scrutiny intensifies on product purity, the adoption of novel purification technologies and single-use filling systems is rising. Innovations that reduce vector aggregation, improve filtration recovery, and enable high-throughput batch processing are gaining market traction.
Gene therapy was the dominant application segment, supported by the broad therapeutic adoption of AAV and lentiviral vectors in treating inherited retinal diseases, hemophilia, and spinal muscular atrophy. Gene therapy products require precise viral vector customization, GMP compliance, and often high-volume batch production, making this segment a major revenue contributor.
Vaccinology is expected to be the fastest-growing segment, particularly post-COVID-19, as mRNA and DNA vaccines become mainstream. Plasmid DNA is the backbone for manufacturing mRNA templates, while viral vectors are used directly in adenoviral-based vaccines. Companies are investing in plasmid production for future pandemic readiness and personalized neoantigen-based cancer vaccines.
Pharmaceutical and biopharmaceutical companies led the market, owing to their extensive involvement in late-stage clinical trials, commercialization of gene-based therapeutics, and growing interest in building internal vector manufacturing capacity. These firms often partner with CDMOs to scale up production or establish hybrid manufacturing models.
Research institutes are growing at a strong pace, driven by government funding, academic spin-offs, and collaborations with biotech startups. These institutions are often the source of early discovery in gene editing and immunotherapy and play a critical role in technology validation and translational medicine.
Based on the disease, Cancer applications dominated the market, with viral vectors and plasmids serving as platforms for CAR-T therapies, oncolytic viruses, and gene silencing. Personalized therapies like autologous CAR-T require rapid and precise vector production, creating strong commercial demand.
Genetic disorders are the fastest-growing segment, especially for one-time treatments using AAV-based gene therapy. Conditions like spinal muscular atrophy (SMA), Duchenne muscular dystrophy, and hemophilia have seen successful trials and approvals, increasing manufacturing demand.
In March 2025, Thermo Fisher Scientific announced the expansion of its viral vector manufacturing capacity in Massachusetts, doubling its footprint to support gene therapy commercialization.
In January 2025, Catalent completed its acquisition of a plasmid DNA manufacturing facility in Switzerland to strengthen its upstream mRNA and CGT offerings.
In October 2024, WuXi AppTec launched a dedicated AAV vector production line at its China-based biologics campus to meet growing demand from regional biotech firms.
In September 2024, Charles River Laboratories and Moderna extended their partnership to support large-scale plasmid production for future mRNA vaccines and personalized oncology programs.
In July 2024, Andelyn Biosciences inaugurated a 200,000 sq. ft. cGMP viral vector manufacturing facility in Ohio, positioning itself as a key U.S.-based CDMO for gene therapy developers.
This report forecasts revenue growth at country levels and provides an analysis of the latest industry trends in each of the sub-segments from 2021 to 2034. For this study, Nova one advisor, Inc. has segmented the viral vector and plasmid DNA manufacturing market
By Vector Type
By Workflow
By Application
By End-use
By Disease
By Regional