Digital Therapeutics Market (By Product Type: Device and Software; By Sales Channel: Business-to-Consumer (B2C) and Business-to-Business (B2B); By Application: Obesity, Diabetes, Central Nervous System (CNS) Disease, Gastrointestinal Disorder (GID), Cardiovascular Disease (CVD), Smoking Cessation, Respiratory Disease, and Others) - Global Market Size, Trends Analysis, Segment Forecasts, Regional Outlook 2024 - 2033

Digital Therapeutics Market Size and Growth

The global digital therapeutics market size was valued at USD 6.85 billion in 2023 and is projected to surpass around USD 44.58 billion by 2033, registering a CAGR of 20.6% over the forecast period of 2024 to 2033.
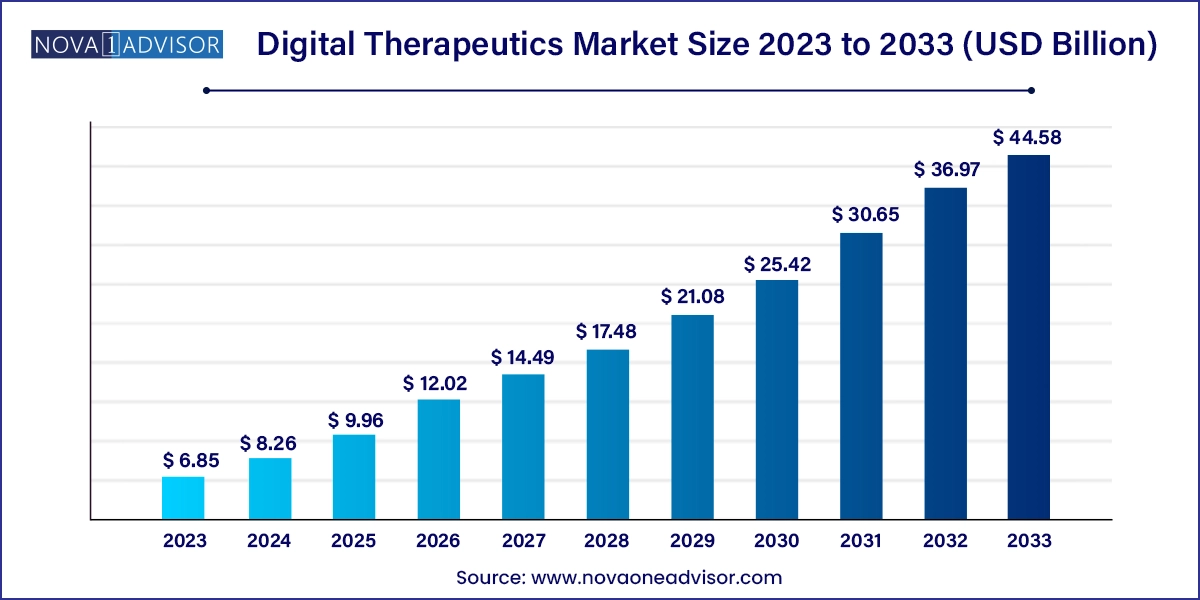
Digital Therapeutics Market Size, 2024 to 2033

Digital Therapeutics Market Key Takeaways

  • North America dominated the market with a revenue share of 42.14% in 2023.
  • Asia Pacific is anticipated to witness substantial growth, with the fastest CAGR of 29.4% over the forecast period.
  • The diabetes segment dominated the market with the largest market share of 29.33% in 2023 and is expected to register the fastest CAGR of 28.9% over the forecast period.
  • Based on end-use, the market is segmented into providers, patients, employers, payers, and others. The patient segment held the largest market share of 35.08% in 2023.

U.S. Digital Therapeutics Market Size and Growth 2024 to 2033

The U.S. digital therapeutics market size was estimated at USD 1.95 billion in 2023 and is projected to hit around USD 13.01 billion by 2033, growing at a CAGR of 20.9% during the forecast period from 2024 to 2033.
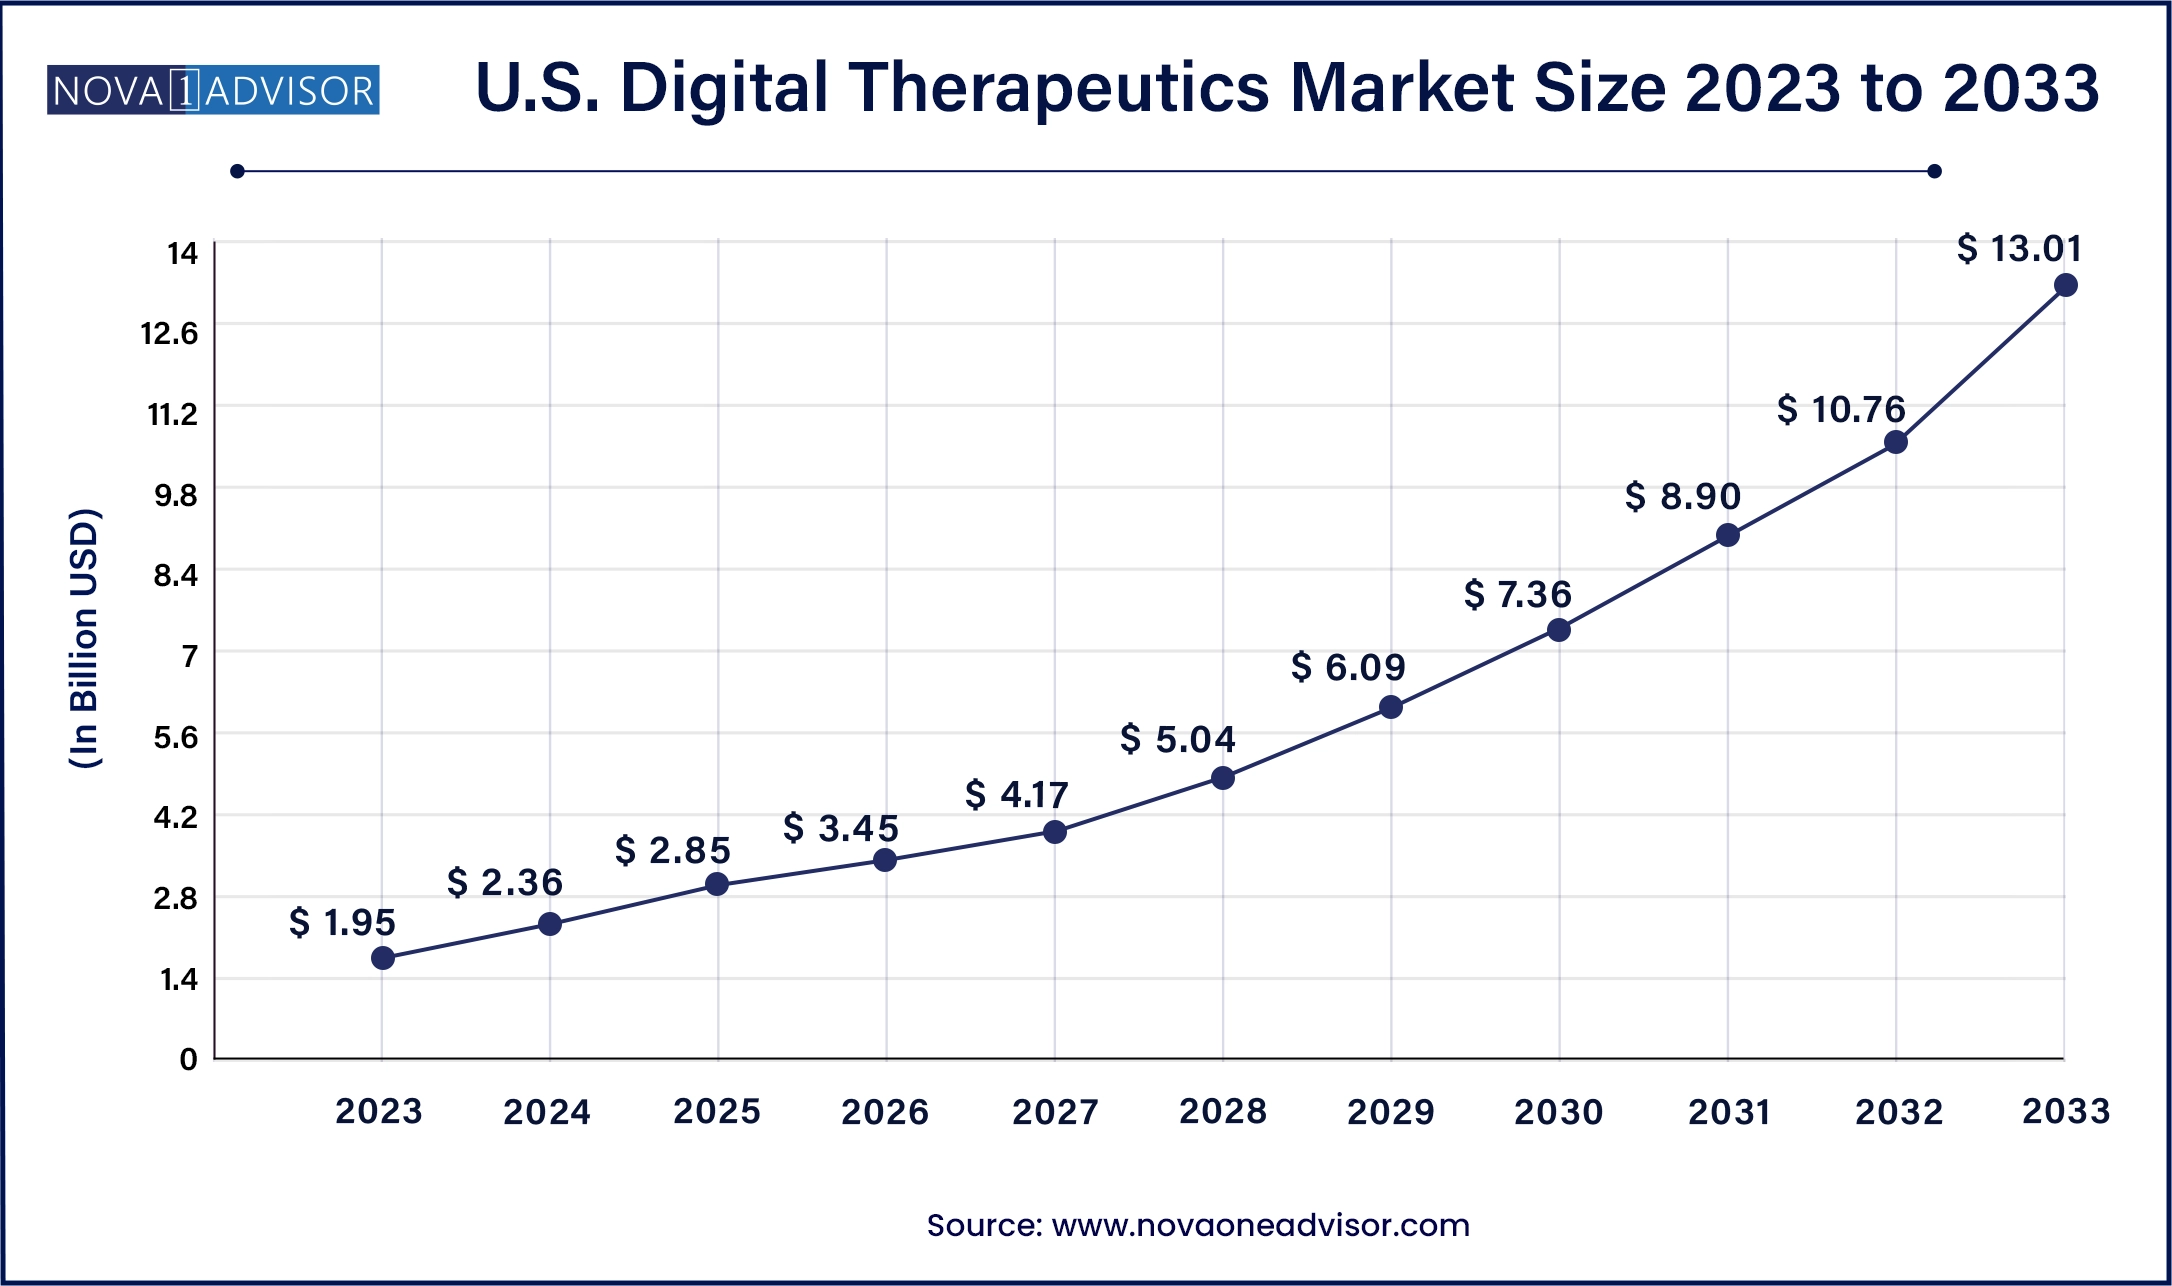
U.S. Digital Therapeutics Market Size, 2024 to 2033

North America dominated the market with a revenue share of 42.14 % in 2023. The overall market in the region is expected to grow significantly over the forecast period owing to favorable reimbursement scenarios focused on improved tracking and diagnosis, and improved quality of life through increased use of digital health products. Moreover, strategic initiatives undertaken by key players in this region, such as new product launches and mergers & acquisitions, are expected to result in lucrative growth.
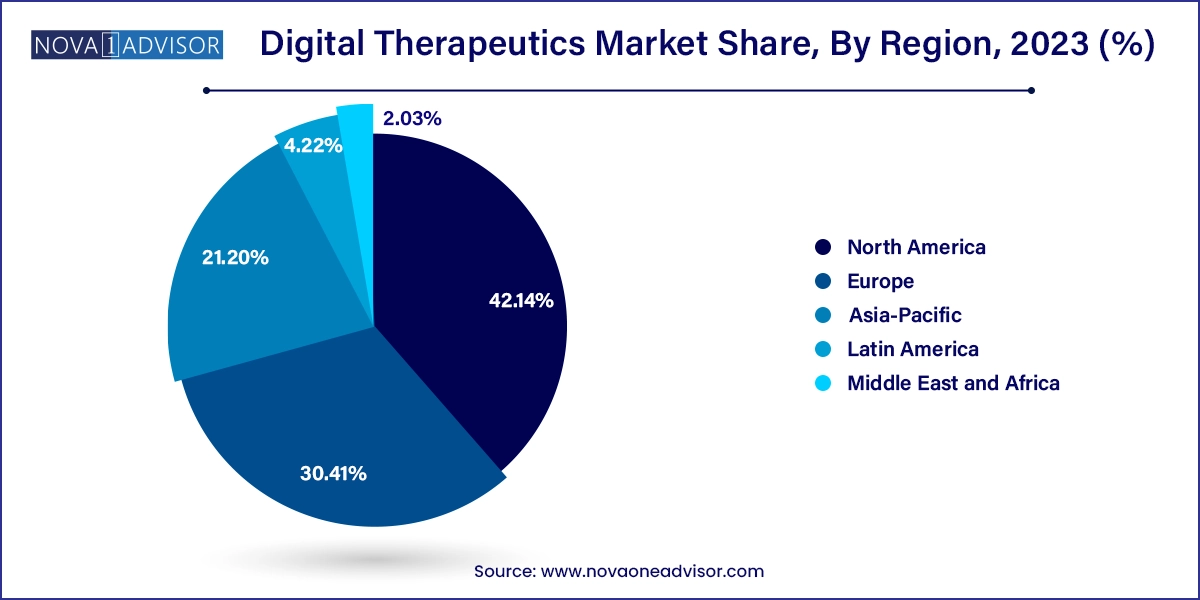
Digital Therapeutics Market Share, By Region, 2023 (%)

Asia Pacific is anticipated to witness substantial growth, with the fastest CAGR of 29.4% over the forecast period due to high demand for IT services and increased government spending on healthcare. Furthermore, demand for healthcare IT systems has been increasing as they enable efficient management of hospitals' clinical, financial, and administrative aspects. A rise in smartphone penetration, an increase in demand for effective healthcare, and improved Internet access are the underlying factors facilitating a rapid increase in Asia Pacific's digital therapeutics industry.

Digital Therapeutics Market Growth 

This growth is being driven mainly by the cost-effectiveness of digital health technology for providers as well as patients and a rapid pace of smartphone penetration in developed & developing economies. According to Kepios, there were 5 billion internet users in April 2022 around the world, which accounted for 63.0% of the global population. As this figure increases, awareness of smart health tracking is expected to enhance. Further, increasing demand for patient-centric care & integrated healthcare systems are expected to drive the market. Supportive reimbursement, the COVID-19 pandemic, early signs of reimbursement, and the rising incidence of chronic diseases are also expected to fuel the market growth.

A rapid rise in internet penetration across the globe had a positive impact on the market. As per The Mobile Economy 2022 statistics published by the GSM Association, the number of people using mobile services was 5.3 billion in 2021, and the number of distinctive mobile subscribers is expected to rise to 5.7 billion by 2025 (70% of the global population). Penetration of smartphones is also rising significantly. The same report states that smartphone penetration was 75% in 2021 and is expected to reach 84% by 2025. Consumers' growing use of smartphones is driving the growth of various mHealth applications in this market.

COVID-19 notably propelled the rate of change in digital therapeutics by accelerating regulatory flexibility, thus expanding access to digital health products and fueling patient demand. The pandemic boosted the demand for accessible and convenient digital health solutions. For instance, as per guidelines released by the FDA in April 2020, for the duration of this pandemic, it would allow the use and distribution of digital health therapeutic devices for psychiatric disorders. Thus, vendors could commercialize their solutions without complying with usual regulatory requirements, provided the devices do not create any undue public health emergency.

Digital Therapeutics Market Report Scope

Report Attribute Details
Market Size in 2024 USD 8.26 Billion
Market Size by 2033 USD 44.58 Billion
Growth Rate From 2024 to 2033 CAGR of 20.6%
Base Year 2023
Forecast Period 2024 to 2033
Segments Covered By Product, By Application, and By Sales Channel, end-use
Market Analysis (Terms Used) Value (US$ Million/Billion) or (Volume/Units)
Report Coverage Revenue forecast, company ranking, competitive landscape, growth factors, and trends
Key Companies Profiled Fitbit Health Solutions, 2MORROW, Inc., Medtronic Plc., Livongo Health, Inc., Pear Therapeutics, Inc., Omada Health, Inc., Resmed, Inc. (Propeller Health), Proteus Digital Health, Inc., Welldoc, Inc.,Voluntis, Inc., Canary Health Inc., Noom, Inc., Mango Health Inc., and Dthera Sciences among others.

Digital Therapeutics Market Market Dynamics

An increasing incidence of chronic diseases significantly contributes to market growth. As per CDC’s National Center for Chronic Disease Prevention and Health Promotion, 6 in 10 American adults suffer from a chronic disease, while 4 out of 10 adults have 2 or more chronic diseases. In February 2022, Chronic Care Complete was launched by Teladoc Health, Inc., which represents the novel solution for complete chronic condition management that aims to improve healthcare outcomes. Additionally, health issues such as cancer, cardiovascular disorders, chronic kidney disease, diabetes, chronic lung disease, and Alzheimer's have been considered to be the leading causes of mortality and disability in the United States.

Growing regulatory initiatives are anticipated to propel standardization and R&D in the market over the forecast period. The Software Pre-Cert Pilot Program is part of the FDA's Digital Health Innovation Action Plan intended to imply a more efficient governing oversight of software-based medical devices (SaMD) developed by manufacturers. The program aims to develop an efficient regulatory oversight for assessing organizations to establish trust that they can develop high-quality Software-as-a-Medical-Device (SaMD) products. For instance, initiatives, such as the National Digital Health Mission (NDHM), are expected to accelerate the adoption rate of the e-healthcare model in India.

Digital Therapeutics Market By Product Type Insights

Software segment captured the major market share in global digital therapeutics market based on product type for the year 2023 and projected to register the fastest growth over the analysis timeframe. This is attributed to the increased penetration of smart devices and phones in the developing regions. Increasing demand for cutting the cost of healthcare facilities across the globe along with integration of advanced technologies such as Artificial Intelligence (AI) and Machine Learning (ML) in digital therapeutic apps are the primary factors that drive the growth of software segment.

Some market players are effectively expanding their product pipeline for machine learning to offer more personalized and advanced Prescription Digital Therapeutic (PDT) platform. For example, in January 2020, Pear Therapeutics Inc., one of the leading solutions providers for Prescription Digital Therapeutics (PDTs), announced to enter into agreements with multiple technology innovators that include Winterlight Labs, Inc., Firsthand Technology, Inc., NeuroLex Laboratories, Inc., and many others. The agreement helps the company to bolster its PDT platform by incorporating machine learning algorithm.

Digital Therapeutics Market By Application Insights

Based on applications, the market is segmented into diabetes, obesity, CVDs, smoking cessation, CNS disease, and others. The diabetes segment dominated the market with the largest market share of 29.33% in 2023 and is expected to register the fastest CAGR of 28.9% over the forecast period. Factors that drive the segment growth include the growing prevalence of diabetes and other chronic diseases.

The growing prevalence of diabetes has driven the need to develop customized solutions for treating patients. As per the CDC, as of 2020, close to 37.3 million people (11.3% of the population) were living with diabetes in the U.S. Similarly, 96 million people above 18 years of age suffered from prediabetes and 38.0% of the U.S. adult population were estimated to face this condition during this period. Thus, digital therapeutics makes this process easier by providing a patient-centric approach. Solutions for diabetes provide patients with technology to help keep track of their routines and treatments daily on wearable devices or smartphones.

The obesity segment held the second-largest market share, due to the growing obesity in population globally. Digital therapeutics provide cost-effective solutions for the treatment of many chronic diseases, which is expected to fuel segment growth in the near future. CVDs and smoking cessation, along with obesity, are expected to demonstrate significant growth rates during the forecast period.

Digital Therapeutics Market By Sales Channel Insights

Based on the sales channel, the business to customer segment dominated the global digital therapeutics market in 2023 with highest market share. This is due to an increase in the prevalence of chronic disorders such as obesity, cancer, diabetes, and high blood pressure, which can be treated by patients only by tracking their physical data. 

Digital Therapeutics Market By End-use Insights

Based on end-use, the market is segmented into providers, patients, employers, payers, and others. The patient segment held the largest market share of 35.08% in 2023, owing to patients' rapid adoption of digital therapeutics. Patients receive evidence-based, personalized care programs. Digital therapeutics can also help improve access to care for people, especially those from rural and remote areas. It can help providers monitor patients in real-time and identify gaps in care, providing timely interventions. It improves the efficiency of care delivery through evidence-based care therapies. These solutions can reduce the need for frequent intervention of physicians in managing people with chronic conditions.

The growth of the providers segment can be attributed to more providers leveraging digital therapeutics to support & deliver therapies that are medically proven, outside of a care setting, in addition to providing reliable patient engagement. Payers are increasingly interested in covering digital therapeutics due to which the segment shows a significant growth scope. Also, they are encouraged to undertake initiatives by business models that facilitate adherence and enhance efficacy while reducing costs.

Digital Therapeutics Market Top Key Companies:

  • Fitbit Health Solutions
  • 2MORROW, Inc.
  • Medtronic Plc.
  • Livongo Health, Inc.
  • Pear Therapeutics, Inc.
  • Omada Health, Inc.
  • Resmed, Inc. (Propeller Health)
  • Proteus Digital Health, Inc.
  • Welldoc, Inc.
  • Voluntis, Inc.
  • Canary Health Inc.
  • Noom, Inc.
  • Mango Health Inc.
  • Dthera Sciences

Digital Therapeutics Market Report Segmentation

This report forecasts revenue growth at country levels and provides an analysis of the latest industry trends in each of the sub-segments from 2021 to 2033. For this study, Nova one advisor, Inc. has segmented the Digital Therapeutics market.

By Product

  • Device
  • Software

By Sales Channel

  • Business-to-Consumer (B2C)
    • Caregiver
    • Patient
  • Business-to-Business (B2B)
    • Healthcare Provider
    • Employer
  • Others

By Application

  • Obesity
  • Diabetes
  • Central Nervous System (CNS) Disease
  • Gastrointestinal Disorder (GID)
  • Cardiovascular Disease (CVD)
  • Smoking Cessation
  • Respiratory Disease
  • Others

By End-use 

  • Patients
  • Providers
  • Payers
  • Employers
  • Others

By Region

  • North America
  • Europe
  • Asia-Pacific
  • Latin America
  • Middle East & Africa (MEA)

Frequently Asked Questions

The global digital therapeutics market size was valued at USD 6.85 billion in 2023 and is projected to surpass around USD 44.58 billion by 2033

The global digital therapeutics market is expected to grow at a compound annual growth rate of 20.6% from 2024to 2033

North America dominated the digital therapeutics market with a share of 42.14% in 2023. This is attributable to the growing number of reforms to curb the increase in healthcare spending in the country coupled with a drive to focus on a patient-centric healthcare approach.

Chapter 1. Introduction

1.1. Research Objective
1.2. Scope of the Study
1.3. Definition

Chapter 2. Research Methodology

2.1. Research Approach
2.2. DataSources
2.3. Assumptions& Limitations

Chapter 3. Executive Summary

3.1. Market Snapshot

Chapter 4. Digital Therapeutics Market Variables and Scope

4.1. Introduction
4.2. Market Classification and Scope
4.3. Market SWOT Analysis

Chapter 5. COVID 19 Impact on Digital Therapeutics Market

5.1. Covid-19: Digital Therapeutics Industry Impact
5.2. Digital Therapeutics Business Impact Assessment: Covid-19
5.2.1. Distribution Channel Challenges/Disruption
5.2.2. Market Trends and Digital Therapeutics Opportunities in the COVID-19 Landscape
5.3. Strategic Measures against Covid-19
5.3.1. Government Support and Initiative to Combat Covid-19
5.3.2. Proposal for Digital Therapeutics Manufacturers to deal with Covid-19 Pandemic Scenario

Chapter 6. Market Dynamics Analysis and Trends

6.1. Market Dynamics
6.1.1. Market Drivers
6.1.1.1. Increasing Penetration of Digital Healthcare Applications & Platforms
6.1.1.2. Rapid Adoption of Smartphones & Tablets
6.1.2. Market Restraints
6.1.2.1. Lack of Proper Monetization Strategy
6.1.3. Market Opportunities
6.1.3.1. Implementation of Machine Learning and Artificial Intelligence in Digital Therapeutics Platforms

Chapter 7. Global Digital Therapeutics Market: Competitive Landscape

7.1.1. Company Market Share/Positioning Analysis
7.1.1.1. Digital Therapeutics Market Revenue by Manufacturer
7.1.1.2. Digital Therapeutics Market Revenue Market Share by Manufacturer
7.1.2. Key Organic/Inorganic Strategies Adopted by Players
7.1.2.1. Product Portfolio Expansion, Capacity Expansion, Product Innovation
7.1.2.2. Merger and Acquisition, Collaboration and Partnerships
7.1.3. Vendor Landscape
7.1.3.1. List of Suppliers
7.1.3.2. List of Buyers

Chapter 8. Global Digital Therapeutics Market, By Product Type

8.1. Digital Therapeutics Market, by Product Type, 2024-2033
8.1.1. Device
8.1.1.1. Market Revenue and Forecast (2021-2033)
8.1.2. Software
8.1.2.1. Market Revenue and Forecast (2021-2033)

Chapter 9. Global Digital Therapeutics Market, By Sales Channel

9.1. Digital Therapeutics Market, by Sales Channel, 2024-2033
9.1.1. Business-to-Consumer (B2C)
9.1.1.1. Market Revenue and Forecast (2021-2033)
9.1.1.2. Caregiver
9.1.1.3. Patient
9.1.2. Business-to-Business (B2B)
9.1.2.1. Market Revenue and Forecast (2021-2033)
9.1.2.2. Healthcare Provider
9.1.2.3. Employer
9.1.2.4. Others

Chapter 10. Global Digital Therapeutics Market, By Application

10.1. Digital Therapeutics Market, by Application, 2024-2033
10.1.1. Obesity
10.1.1.1. Market Revenue and Forecast (2021-2033)
10.1.2. Diabetes
10.1.2.1. Market Revenue and Forecast (2021-2033)
10.1.3. Central Nervous System (CNS) Disease
10.1.3.1. Market Revenue and Forecast (2021-2033)
10.1.4. Gastrointestinal Disorder (GID)
10.1.4.1. Market Revenue and Forecast (2021-2033)
10.1.5. Cardiovascular Disease (CVD)
10.1.5.1. Market Revenue and Forecast (2021-2033)
10.1.6. Smoking Cessation
10.1.6.1. Market Revenue and Forecast (2021-2033)
10.1.7. Respiratory Disease
10.1.7.1. Market Revenue and Forecast (2021-2033)
10.1.8. Others
10.1.8.1. Market Revenue and Forecast (2021-2033)

Chapter 11. Global Digital Therapeutics Market, Regional Estimates and Trend Forecast

11.1. North America
11.1.1. Market Revenue Forecast by Product Type (2021-2033)
11.1.2. Market Revenue Forecast by Sales Channel (2021-2033)
11.1.3. Market Revenue Forecast by Application (2021-2033)
11.1.4. U.S
11.1.4.1. Market Revenue Forecast (2021-2033)
11.1.5. Canada
11.1.5.1. Market Revenue Forecast (2021-2033)
11.2. Europe
11.2.1. Market Revenue Forecast by Product Type (2021-2033)
11.2.2. Market Revenue Forecast by Sales Channel (2021-2033)
11.2.3. Market Revenue Forecast by Application (2021-2033)
11.2.4. UK
11.2.4.1. Market Revenue Forecast (2021-2033)
11.2.5. Germany
11.2.5.1. Market Revenue Forecast (2021-2033)
11.2.6. France
11.2.6.1. Market Revenue Forecast (2021-2033)
11.2.7. Rest of EU
11.2.7.1. Market Revenue Forecast (2021-2033)
11.3. Asia Pacific (APAC)
11.3.1. Market Revenue Forecast by Product Type (2021-2033)
11.3.2. Market Revenue Forecast by Sales Channel (2021-2033)
11.3.3. Market Revenue Forecast by Application (2021-2033)
11.3.4. China
11.3.4.1. Market Revenue Forecast (2021-2033)
11.3.5. India
11.3.5.1. Market Revenue Forecast (2021-2033)
11.3.6. Japan
11.3.6.1. Market Revenue Forecast (2021-2033)
11.3.7. Rest of APAC
11.3.7.1. Market Revenue Forecast (2021-2033)
11.4. LATAM
11.4.1. Market Revenue Forecast by Product Type (2021-2033)
11.4.2. Market Revenue Forecast by Sales Channel (2021-2033)
11.4.3. Market Revenue Forecast by Application (2021-2033)
11.4.4. Brazil
11.4.4.1. Market Revenue Forecast (2021-2033)
11.4.5. Rest of LATAM
11.4.5.1. Market Revenue Forecast (2021-2033)
11.5. Middle East and Africa (MEA)
11.5.1. Market Revenue Forecast by Product Type (2021-2033)
11.5.2. Market Revenue Forecast by Sales Channel (2021-2033)
11.5.3. Market Revenue Forecast by Application (2021-2033)
11.5.4. GCC
11.5.4.1. Market Revenue Forecast (2021-2033)
11.5.5. North Africa
11.5.5.1. Market Revenue Forecast (2021-2033)
11.5.6. South Africa
11.5.6.1. Market Revenue Forecast (2021-2033)
11.5.7. Rest of MEA
11.5.7.1. Market Revenue Forecast (2021-2033)

Chapter 12. Company Profiles

12.1. Fitbit Health Solutions
12.1.1. Company Overview, Business Information, Manufacturing Area
12.1.2. Product Portfolio Analysis
12.1.2.1. Product Details, Specification, Application
12.1.3. Revenue, Price and Gross Margin
12.1.4. Recent Developments and Strategies
12.2. 2MORROW, Inc.
12.2.1. Company Overview, Business Information, Manufacturing Area
12.2.2. Product Portfolio Analysis
12.2.2.1. Product Details, Specification, Application
12.2.3. Revenue, Price and Gross Margin
12.2.4. Recent Developments and Strategies
12.3. Medtronic Plc.
12.3.1. Company Overview, Business Information, Manufacturing Area
12.3.2. Product Portfolio Analysis
12.3.2.1. Product Details, Specification, Application
12.3.3. Revenue, Price and Gross Margin
12.3.4. Recent Developments and Strategies
12.4. Livongo Health, Inc.
12.4.1. Company Overview, Business Information, Manufacturing Area
12.4.2. Product Portfolio Analysis
12.4.2.1. Product Details, Specification, Application
12.4.3. Revenue, Price and Gross Margin
12.4.4. Recent Developments and Strategies
12.5. Pear Therapeutics, Inc.
12.5.1. Company Overview, Business Information, Manufacturing Area
12.5.2. Product Portfolio Analysis
12.5.2.1. Product Details, Specification, Application
12.5.3. Revenue, Price and Gross Margin
12.5.4. Recent Developments and Strategies
12.6. Omada Health, Inc.
12.6.1. Company Overview, Business Information, Manufacturing Area
12.6.2. Product Portfolio Analysis
12.6.2.1. Product Details, Specification, Application
12.6.3. Revenue, Price and Gross Margin
12.6.4. Recent Developments and Strategies
12.7. Resmed, Inc. (Propeller Health)
12.7.1. Company Overview, Business Information, Manufacturing Area
12.7.2. Product Portfolio Analysis
12.7.2.1. Product Details, Specification, Application
12.7.3. Revenue, Price and Gross Margin
12.7.4. Recent Developments and Strategies
12.8. Proteus Digital Health, Inc.
12.8.1. Company Overview, Business Information, Manufacturing Area
12.8.2. Product Portfolio Analysis
12.8.2.1. Product Details, Specification, Application
12.8.3. Revenue, Price and Gross Margin
12.8.4. Recent Developments and Strategies
12.9. Welldoc, Inc.
12.9.1. Company Overview, Business Information, Manufacturing Area
12.9.2. Product Portfolio Analysis
12.9.2.1. Product Details, Specification, Application
12.9.3. Revenue, Price and Gross Margin
12.9.4. Recent Developments and Strategies
12.10. Voluntis, Inc.
12.10.1. Company Overview, Business Information, Manufacturing Area
12.10.2. Product Portfolio Analysis
12.10.2.1. Product Details, Specification, Application
12.10.3. Revenue, Price and Gross Margin
12.10.4. Recent Developments and Strategies

Chapter 13. Appendix

13.1. About Us
13.2. Glossary of Terms

Proceed To Buy

USD 4500
USD 3800
USD 1900
USD 1200

Customization Offered

  • check-img Cross-segment Market Size and Analysis for Mentioned Segments
  • check-imgAdditional Company Profiles (Upto 5 With No Cost)
  • check-img Additional Countries (Apart From Mentioned Countries)
  • check-img Country/Region-specific Report
  • check-img Go To Market Strategy
  • check-imgRegion Specific Market Dynamics
  • check-imgRegion Level Market Share
  • check-img Import Export Analysis
  • check-imgProduction Analysis
  • check-imgOthers