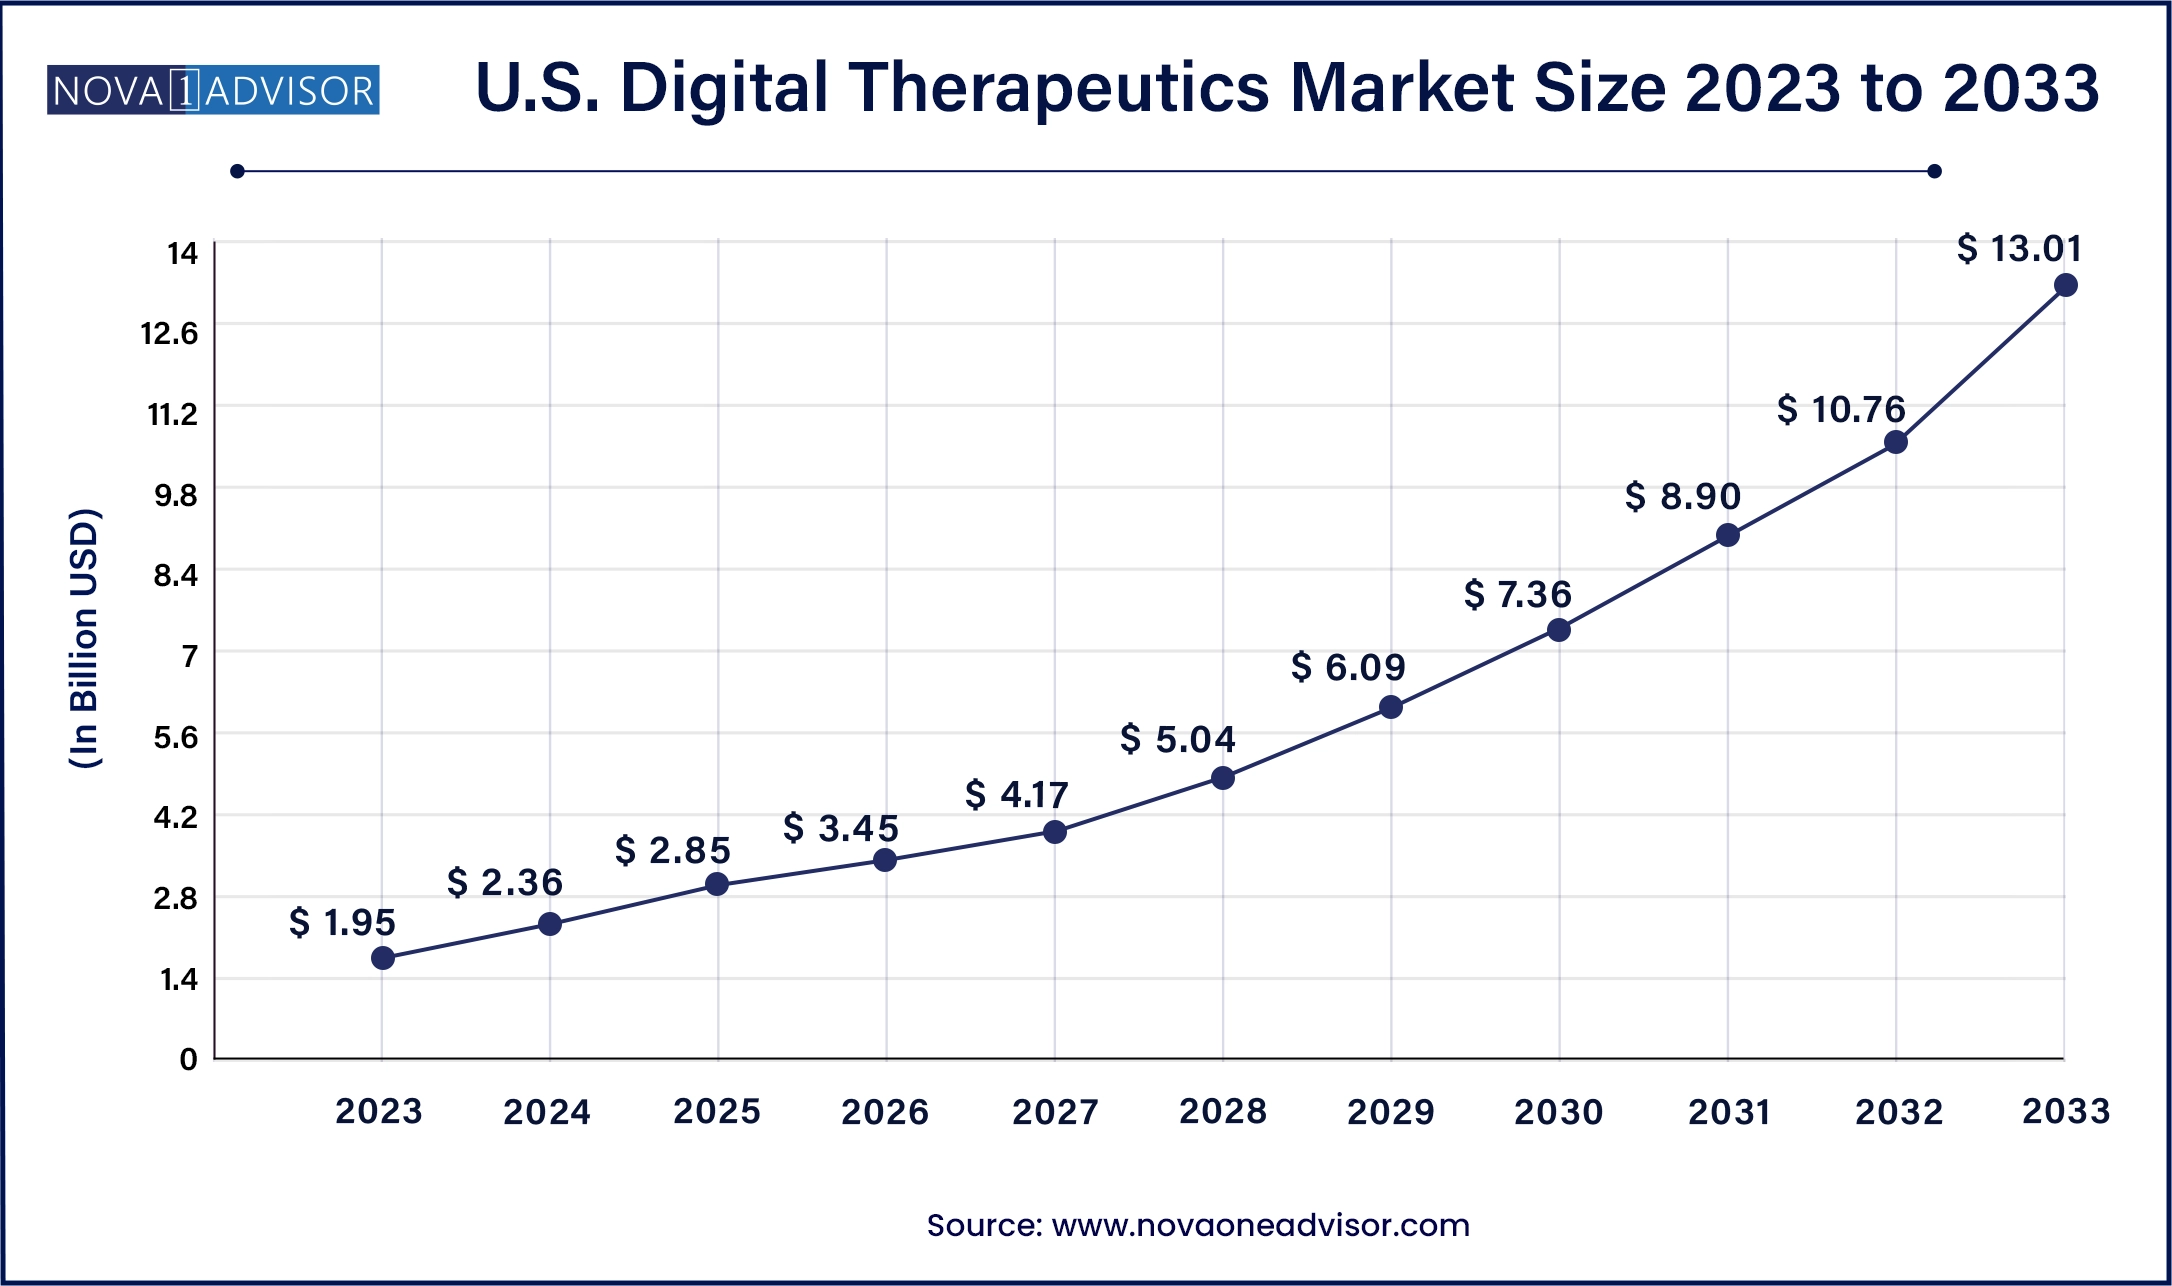
The U.S. digital therapeutics market size was valued at USD 1.95 billion in 2023 and is anticipated to reach around USD 13.01 billion by 2033, growing at a CAGR of 20.9% from 2024 to 2033.

The continuously changing digital landscape, rising consumerism in healthcare, the COVID-19 pandemic, and initiatives by key companies are some of the key factors fueling the market growth. In October 2021, Click Therapeutics, Inc. received USD 52 million in Series B funding from multiple investors. This enabled the development and commercialization of the company’s prescription digital therapeutic pipeline, while also helping the company advance its platform capabilities.
Technological advancements aiming to provide transformational healthcare solutions are further anticipated to assist the market growth in the near future. In June 2020, ATAI Life Sciences, in an attempt to enter the digital therapeutics space, launched the IntroSpect Digital Therapeutics platform. The company will provide DTx and precision psychiatry solutions in a probe to combat burgeoning mental health disorders.
The increasing number of smartphone users in the U.S. is another key factor driving the market growth. Awareness of smart health tracking is also expected to increase in the country due to the rapid proliferation of smart healthcare devices. Digital therapeutics can offer on-demand care to patients, with the ability to diagnose and treat patients earlier. Moreover, biopharmaceutical companies are collaborating with digital therapeutic providers to give patients a better quality of care, thereby propelling growth.
Despite the advantages of DTx services and a large smartphone user base in the U.S., it never experienced mass consumer adoption before the COVID-19 outbreak. The pandemic created a major growth opportunity for this technology. CMS and FDA have already mentioned the vital nature of virtual care services in the overall COVID-19 response strategy.
Social distancing and self-isolation have resulted in increased anxiety & stress. According to Mental Health America, there was nearly a 19% increase in clinical anxiety in the first week of February 2020, and around a 12% increase in the first two weeks of March. DTx therapies can help manage these conditions and provide evidence-based solutions. Companies such as BigHealth, Happify, Palo Alto Health Science, and Pear Therapeutics are constantly trying to increase their consumer base and reach out to more patients during this pandemic.
| Report Attribute | Details |
| Market Size in 2024 | USD 2.36 Billion |
| Market Size by 2033 | USD 13.01 Billion |
| Growth Rate From 2024 to 2033 | CAGR of 20.9% |
| Base Year | 2023 |
| Forecast Period | 2024 to 2033 |
| Segments Covered | By Application, By Product, and By End Use |
| Market Analysis (Terms Used) | Value (US$ Million/Billion) or (Volume/Units) |
| Report Coverage | Revenue forecast, company ranking, competitive landscape, growth factors, and trends |
| Key Companies Profiled | Omada Health Inc., 2Morrow Inc., Teladoc Health, Inc, Pear Therapeutics (U.S), Inc., Fitbit Health Solutions, Welldoc, Inc, Click Therapeutics, Noom, Inc., Akili, Inc., Better Therapeutics, Inc. |
Drivers
Rising demand for digital therapeutics
The demand for U.S. digital therapeutics is on the rise owing to increased penetration of digital healthcare applications and platforms due to the rapid adoption of smartphones, tablets, and smart wearables is likely to drive market growth in the coming years. The Rising prevalence of chronic diseases with the growing need to control the rising cost of healthcare facilities is another factor that is expected to drive the market growth. Furthermore, constantly changing digital platforms in many industries have encouraged consumers to use these digital platforms. Also, increased awareness about health and fitness are the major drivers that boost the market in the upcoming years.
Restrains
Data privacy concerns
The various health applications lack the necessary authorization raising issues about the product and data quality, patient privacy, security, and data use responsibly. Digital therapeutics providers have access to the patient’s information but are not permitted to share information about who is involved in the patient’s treatment. However, with the digital technologies to consolidate data, the patient’s information is at risk which can be accessed by any healthcare professional who is not involved in patients’ treatment procedure. As a result, data privacy issues are impeding the growth of the market during the forecast period.
Opportunities
Rising investments and strategic acquisition
Increased pharma investment and healthcare-focused start-ups are more likely to act as market drivers for digital therapeutics, influencing and shaping the future of digital therapeutics. There is also a positive trend for digital medication reimbursement, with 25% of organizations currently covering them and another 45% promising to do so in the future. Consolidation in the digital therapeutics sector is ongoing, with vendors expanding their market presence through strategic acquisitions and collaborations with pharmaceutical companies. Mergers and acquisitions are being used by global and prominent regional suppliers to enhance their market positions and extend their product ranges.
Furthermore, the growing emphasis on strategic acquisitions and the formation of collaborative partnerships among key stakeholders such as providers, payers, and the US federal government to meet prevalent unmet patient needs and provide supportive healthcare services in remote locations is contributing to the growth of the digital therapeutics market in the US. These strategic alliances will boost healthcare infrastructure utilization, enhance patient and physician interaction, and deliver improved disease management and patient access services.
COVID-19 Impact
Following the outbreak of the COVID-19 pandemic, the use of DTx applications in a variety of industries increased significantly. DTx offers one-of-a-kind solutions to meet healthcare needs, lowering the risk of COVID-19 exposure during a hospital visit. The COVID-19 pandemic joined other main drivers of DTx growth, including a greater emphasis on preventative healthcare, a high prevalence of chronic diseases, and more cheap devices as a result of technological advancements. DTx became a significant participant in the digital health sector after COVID, and its scope is anticipated to raise the US digital therapeutics market.
Diabetes dominated the application segment in 2023 with more than 33.7% of the revenue share. Diabetes prevalence is growing rapidly and is linked to blindness, heart attack, kidney failure, stroke, and gangrene in severe cases. Digital therapeutics are being used for the management & prevention of diseases by helping patients change their behavior through constant monitoring, thus improving their health in the long run.
Based on application, the U.S. digital therapeutics market is segmented into diabetes, obesity, CVD, respiratory diseases, smoking cessation, CNS diseases, and others. The CNS diseases segment is expected to show significant growth during the forecast period, owing to the increasing incidence of neurological diseases in the U.S. Alzheimer’s disease, expressive aphasia, degenerative diseases, Huntington’s disease, multiple sclerosis, and Parkinson’s disease are some of the most common neurological diseases that affect a growing proportion of the U.S. population.
Several digital therapeutics companies have been catering to the specific needs of Central Nervous System (CNS) disease patients to reduce anxiety and keep track of their daily activities. The demand has increased after the nationwide lockdown brought on by the COVID-19 pandemic.
According to a KFF tracking poll, around 47% of Americans staying at home have reported negative mental health effects as of March 2020. Out of them, over 21% have reported a major negative impact on their mental health. The FDA has released new guidelines for the computerized behavioral therapy and other DTx solutions during this public health emergency, which is expected to fuel the growth.
Based on product, the U.S. digital therapeutics market is segmented into software and devices. The software segment is estimated to hold the largest market share during the forecast period. This is due to the rise in demand for the reduction of healthcare costs globally. This would provide immense opportunities to developers to use existing software and also develop new and advanced features to make them more effective and affordable. This is estimated to help propel the U.S. digital therapeutics market size.
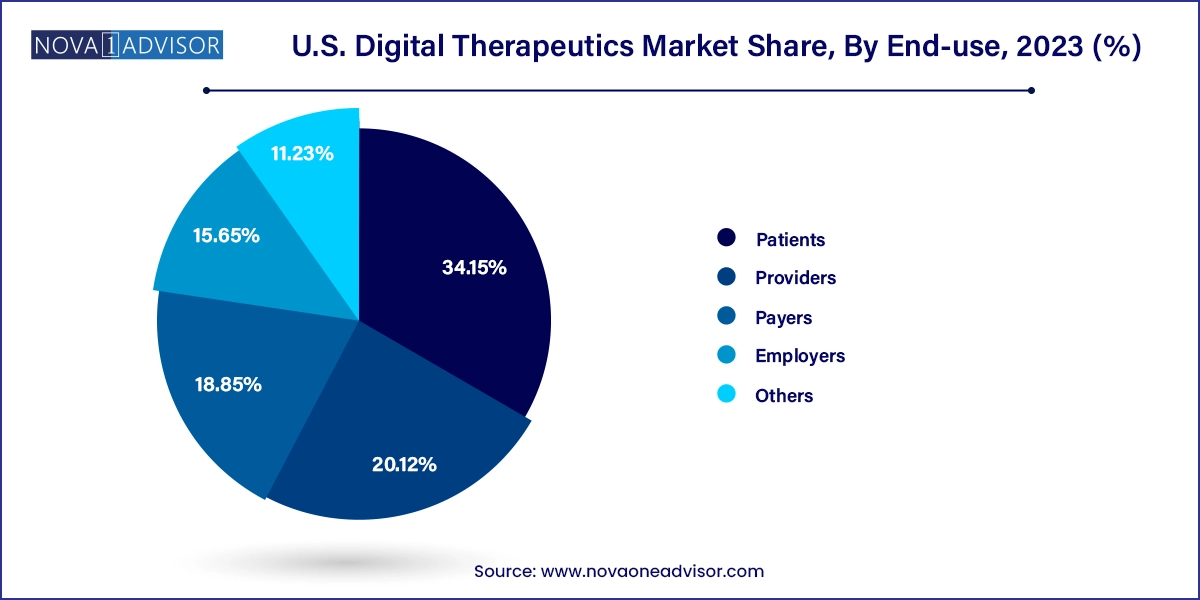
The patient end-user segment dominated the overall market with more than 34.15% of the revenue share in 2023. The increased adoption of these tools can be attributed to their added benefits, one of which is effective health management at an affordable cost. In addition, the presence of advanced healthcare IT solutions and supportive government programs in the country are factors expected to further boost the adoption of digital therapeutics by patients.

Based on end-use, the market is segmented into patients, providers, payers, employers, & other end-users. The employer segment is expected to show notable growth during the forecast period. Employers are focusing on the management of employee healthcare costs, which is expected to drive segment growth. Moreover, growing awareness through employee healthcare programs is expected to propel the adoption of digital therapeutics for maintaining employee wellbeing.
The availability of various mHealth apps, such as Vida Health, used by payers, providers, and employers to monitor chronic conditions such as prediabetes, obesity, hypertension, & mental health issues, is another factor expected to propel market growth.
This report forecasts revenue growth at country levels and provides an analysis of the latest industry trends in each of the sub-segments from 2021 to 2033. For this study, Nova one advisor, Inc. has segmented the U.S. Digital Therapeutics market.
By Application
By Product
By End Use
By Region