The U.S. molecular diagnostics market size was exhibited at USD 6.11 billion in 2023 and is projected to hit around USD 9.81 billion by 2033, growing at a CAGR of 8.84% during the forecast period 2024 to 2033.
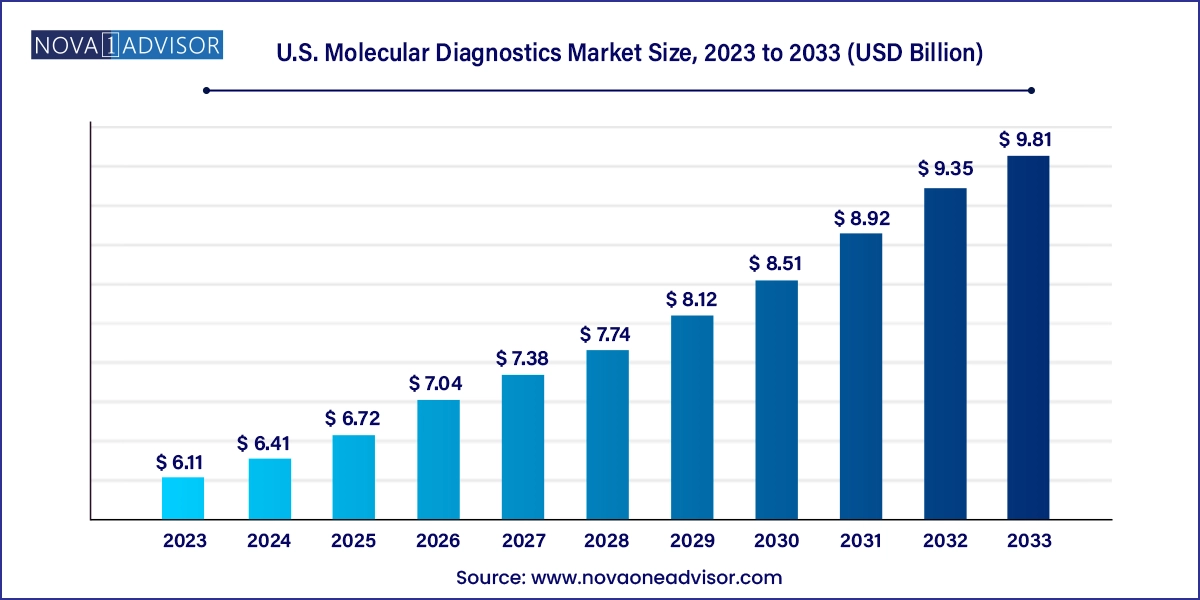
Report Coverage | Details |
Market Size in 2024 | USD 6.41 Billion |
Market Size by 2033 | USD 9.81 Billion |
Growth Rate From 2024 to 2033 | CAGR of 4.84% |
Base Year | 2023 |
Forecast Period | 2024-2033 |
Segments Covered | Disease, End-use |
Market Analysis (Terms Used) | Value (US$ Million/Billion) or (Volume/Units) |
Country scope | U.S. |
Key Companies Profiled | Abbott; Siemens Healthcare GmbH; QIAGEN; F. Hoffmann-La Roche Ltd; Quest Diagnostics Incorporated; Danaher; Thermo Fisher Scientific, Inc.; Hologic Inc.; BD; Charles River Laboratories; Bio-Rad Laboratories, Inc.; Illumina, Inc.; Agilent Technologies, Inc. |
The increasing prevalence of infections and technological advancements in molecular diagnostic tests drive the market. Furthermore, the presence of favorable reimbursement policies coupled with rising government support in the form of funding and initiatives for the development of diagnostics tests is anticipated to drive the U.S. molecular diagnostics growth over the forecast period.
The COVID-19 pandemic has positively impacted the market by encouraging players to develop novel and rapid diagnostic kits capable of detecting coronavirus. This has resulted in positive revenue growth for major market players operating in the infectious disease segment. For instance, Thermo Fisher Scientific reported 150% revenue growth owing to the rising demand for diagnostics offerings in April 2021. However, the rising adoption of vaccination in the region is anticipated to reduce the demand for COVID-19 testing over the forecast period.
Moreover, increasing incidences of infections in the country primarily drive the demand for cost-effective and efficient diagnostics techniques. According to a study published by the Journal of Clinical Virology in March 2023, enterovirus infection incidents increased by 21.7% compared to the previous year. Furthermore, enterovirus majorly affects the population with ages less than 5 years, of which around 41% of the infected toddlers require supplemental oxygen. In addition, according to the article published by the National Library of Medicine in May 2021, around 40 % of the U.S. population in the U.S. is affected by H. pylori infection every year.
The presence of government support in the form of approvals and funding is anticipated to fuel the market growth over the forecast period. For instance, in May 2023, Abbot received approval for its Alinity m STI Assay from the U.S. FDA. The test is capable of differentiating and detecting STIs. In addition, in 2020, ASPR’s Biomedical Advanced Research and Development Authority and NIH’s National Institute of Allergy and Infectious Diseases organized the Antimicrobial Resistance Diagnostic Challenge in which Visby Medical’s rapid PCR test won USD 19 million in federal funding.
High prices associated with molecular tests are one of the major factors impeding the market for U.S. molecular diagnostics. Furthermore, the scarcity of comparable tests is another reason for price hikes. The significant variations in prices for different applications of each molecular diagnostic product further compound this problem. However, the presence of favorable reimbursement policies in the country is anticipated to fuel the market demand. For instance, in January 2023, the U.S. Department of Health and Human Services announced that individuals with group health plans or covered by private health insurance who purchase at-home COVID-19 tests will get benefits of cost coverage from the insurance or plan.
The respiratory disease segment dominated the market with a share of 41.79% in 2023. The growth is attributed to the increasing prevalence of respiratory infections such as HPIVs, MDR-TB, and group A streptococcal, among others, coupled with the increasing awareness regarding the availability of diagnostics tests for diagnosing and treatment of infections. According to a study conducted by the CDC, there has been a significant increase in the number of parainfluenza infections till December 2023. This is further contributing to the growing number of hospitalizations caused by HPIVs.
The healthcare-associated infections segment is anticipated to witness the fastest growth from 2024 to 2033. The growth is attributed to the increasing incidences of HAI and technological advancements in diagnostic techniques are driving the growth. According to a study published by the National Library of Medicine in December 2023, around 4% of the total hospitalizations are affected by HAI in the U.S. every year. Furthermore, rising government support in the form of initiatives to reduce the incidence of infections during hospitalizations is anticipated to fuel the growth over the forecast period. For instance, in 2023, the Centers for Medicare & Medicaid Services introduced the Hospital-Acquired Condition (HAC) Reduction Program to encourage hospitals to reduce incidences of infection during hospitalization and improve overall patient safety.
The hospital core laboratory held the largest share of 39.43% of the market for U.S. molecular diagnostics in 2023 and is anticipated to grow at the fastest CAGR over the forecast period. The segment growth is attributed to the increasing prevalence of infections, such as MRSA, Staphylococcus aureus (SA), and enterovirus. According to a study published by NCBI in May 2023, the prevalence of SA carriage was found to be 30.2% among individuals aged between 18 years and 64 years, 20.7% among children, and 16.7% among people aged more than 65 years.
Reference labs are also expected to register a considerable CAGR during the forecast period. Increasing government support through initiatives and reimbursement policies is anticipated to drive market growth over the forecast period. For instance, in March 2023, the U.S. government launched the AHRQ Safety Program for MRSA Prevention. The program is anticipated to boost the demand for molecular diagnostic techniques by creating awareness regarding multidrug-resistant organisms and MRSA transmission.
This report forecasts revenue growth at country levels and provides an analysis of the latest industry trends in each of the sub-segments from 2021 to 2033. For this study, Nova one advisor, Inc. has segmented the U.S. molecular diagnostics market
Disease
End-use
Chapter 1. Methodology and Scope
1.1. Market Segmentation & Scope
1.1.1. Disease
1.1.2. End-use
1.1.3. Estimates and forecast timeline
1.2. Research Methodology
1.3. Information Procurement
1.3.1. Purchased database
1.3.2. internal database
1.3.3. Secondary sources
1.3.4. Primary research
1.4. Information or Data Analysis
1.4.1. Data analysis models
1.5. Market Formulation & Validation
1.6. Model Details
1.6.1. Commodity flow analysis (Model 1)
1.6.1.1. Approach 1: Commodity flow approach
1.6.2. Volume price analysis (Model 2)
1.6.2.1. Approach 2: Volume price analysis
1.7. List of Secondary Sources
1.8. List of Primary Sources
1.9. Objectives
1.9.1. Objective 1
1.9.2. Objective 2
Chapter 2. Executive Summary
2.1. Market Outlook
2.2. Segment Outlook
2.2.1. Disease outlook
2.2.2. End-use outlook
2.3. Competitive Insights
Chapter 3. U.S. Molecular Diagnostics Market Variables, Trends & Scope
3.1. Market Lineage Outlook
3.1.1. Parent market outlook
3.1.2. Related/ancillary market outlook
3.2. Penetration & Growth Prospect Mapping
3.3. Industry Value Chain Analysis
3.4. Market Dynamics
3.4.1. Market Driver Analysis
3.4.1.1. Increase in geriatric population
3.4.1.2. Introduction of technologically advanced products
3.4.1.3. Increase in demand for point-of-care testing
3.4.1.4. Growing prevalence of target diseases
3.4.1.5. Increasing external funding for R&D
3.4.2. Market Restraint Analysis
3.4.2.1. Presence of Ambiguous Regulatory Framework
3.4.2.2. High prices of molecular diagnostics tests
3.5. U.S. Molecular Diagnostics Market Analysis Tools
3.5.1. Industry Analysis - Porter’s
3.5.1.1. Supplier power
3.5.1.2. Buyer power
3.5.1.3. Substitution threat
3.5.1.4. Threat of new entrant
3.5.1.5. Competitive rivalry
3.5.2. PESTEL Analysis
3.5.2.1. Political landscape
3.5.2.2. Technological landscape
3.5.2.3. Economic Landscape
3.5.3. Major Deals & Strategic Alliances Analysis
3.5.4. Market Entry Strategies
Chapter 4. U.S. Molecular Diagnostics Market: Disease Estimates & Trend Analysis
4.1. Market Size & Forecasts and Trend Analyses, 2021 to 2033 for the following
4.1.1. Healthcare-Associated Infections
4.1.1.1. Methicillin-Resistant Staphylococcus aureus
4.1.1.1.1. Methicillin-Resistant Staphylococcus aureus Market Estimates and forecast 2021 to 2033 (USD Million)
4.1.1.2. Staphylococcus aureus
4.1.1.2.1. Staphylococcus aureus Market Estimates and forecast 2021 to 2033 (USD Million)
4.1.1.3. Enterovirus
4.1.1.3.1. Enterovirus market estimates and forecast 2021 to 2033 (USD Million)
4.1.1.4. Clostridioides difficile
4.1.1.4.1. Clostridioides difficile market estimates and forecast 2021 to 2033 (USD Million)
4.1.1.5. Van A
4.1.1.5.1. Van A market estimates and forecast 2021 to 2033 (USD Million)
4.1.1.6. Sepsis Panel
4.1.1.6.1. Sepsis Panel market estimates and forecast 2021 to 2033 (USD Million)
4.1.2. Respiratory
4.1.2.1. Flu
4.1.2.1.1. Flu market estimates and forecast 2021 to 2033 (USD Million)
4.1.2.2. Respiratory Syncytial Virus
4.1.2.2.1. Respiratory Syncytial Virus market estimates and forecast 2021 to 2033 (USD Million)
4.1.2.3. Paraflu
4.1.2.3.1. Paraflu market estimates and forecast 2021 to 2033 (USD Million)
4.1.2.4. Multidrug-Resistant Tuberculosis
4.1.2.4.1. Multidrug-Resistant Tuberculosis market estimates and forecast 2021 to 2033 (USD Million)
4.1.2.5. Mycobacterium Avium-Intracellular
4.1.2.5.1. Mycobacterium Avium-Intracellulare market estimates and forecast 2021 to 2033 (USD Million)
4.1.2.6. Group A Streptococcal
4.1.2.6.1. Group A Streptococcal market estimates and forecast 2021 to 2033 (USD Million)
4.1.2.7. Adenovirus
4.1.2.7.1. Adenovirus market estimates and forecast 2021 to 2033 (USD Million)
4.1.2.8. Human Metapneumovirus
4.1.2.8.1. Human Metapneumovirus market estimates and forecast 2021 to 2033 (USD Million)
4.1.2.9. Rhinoviruses
4.1.2.9.1. Rhinoviruses market estimates and forecast 2021 to 2033 (USD Million)
4.1.2.10. Middle East Respiratory Syndrome Coronavirus
4.1.2.10.1. Middle East Respiratory Syndrome Coronavirus market estimates and forecast 2021 to 2033 (USD Million)
4.1.2.11. Tuberculosis
4.1.2.11.1. Tuberculosis market estimates and forecast 2021 to 2033 (USD Million)
4.1.2.12. Severe Acute Respiratory Syndrome Coronavirus 2
4.1.2.12.1. Severe Acute Respiratory Syndrome Coronavirus 2 market estimates and forecast 2021 to 2033 (USD Million)
4.1.2.13. Human Bocavirus-Infection
4.1.2.13.1. Human Bocavirus-Infection market estimates and forecast 2021 to 2033 (USD Million)
4.1.2.14. Bordetella
4.1.2.14.1. Bordetella market estimates and forecast 2021 to 2033 (USD Million)
4.1.2.15. Mycoplasma Pneumonia
4.1.2.15.1. Mycoplasma Pneumonia market estimates and forecast 2021 to 2033 (USD Million)
4.1.2.16. Respiratory Panels
4.1.2.16.1. Respiratory Panels market estimates and forecast 2021 to 2033 (USD Million)
4.1.3. Gastrointestinal
4.1.3.1. Norovirus
4.1.3.1.1. Norovirus market estimates and forecast 2021 to 2033 (USD Million)
4.1.3.2. Helicobacter pylori
4.1.3.2.1. Helicobacter pylori market estimates and forecast 2021 to 2033 (USD Million)
4.1.3.3. Shiga toxin
4.1.3.3.1. Shiga toxin Market Estimates and forecast 2021 to 2033 (USD Million)
4.1.3.4. GI Parasite Panel
4.1.3.4.1. GI Parasite Panel market estimates and forecast 2021 to 2033 (USD Million)
4.1.3.5. GI Bacterial Panel
4.1.3.5.1. GI Bacterial Panel market estimates and forecast 2021 to 2033 (USD Million)
4.1.3.6. GI Viral Panel
4.1.3.6.1. GI Viral Panel market estimates and forecast 2021 to 2033 (USD Million)
4.1.3.7. GI Panels
4.1.3.7.1. GI Panels market estimates and forecast 2021 to 2033 (USD Million)
4.1.4. Women’s Health/STI
4.1.4.1. Chlamydia trachomatis (CT)/Neisseria gonorrhoeae (NG)
4.1.4.1.1. Chlamydia trachomatis (CT)/Neisseria gonorrhoeae (NG) market estimates and forecast 2021 to 2033 (USD Million)
4.1.4.2. Trichomonas Vaginalis
4.1.4.2.1. Trichomonas Vaginalis market estimates and forecast 2021 to 2033 (USD Million)
4.1.4.3. Mycoplasma Genitalium
4.1.4.3.1. Mycoplasma genitalium market estimates and forecast 2021 to 2033 (USD Million)
4.1.4.4. Human Papillomavirus
4.1.4.4.1. Human Papillomavirus market estimates and forecast 2021 to 2033 (USD Million)
4.1.4.5. Bacterial Vaginosis
4.1.4.5.1. Bacterial Vaginosis market estimates and forecast 2021 to 2033 (USD Million)
4.1.4.6. Gonorrhoea Colloquially
4.1.4.6.1. Gonorrhoea Colloquially market estimates and forecast 2021 to 2033 (USD Million)
4.1.4.7. Mycoplasma Genitalium Resistance
4.1.4.7.1. Mycoplasma Genitalium Resistance market estimates and forecast 2021 to 2033 (USD Million)
4.1.4.8. Herpes Simplex Virus
4.1.4.8.1. Herpes Simplex Virus market estimates and forecast 2021 to 2033 (USD Million)
4.1.4.9. Group B Streptococcus
4.1.4.9.1. Group B Streptococcus market estimates and forecast 2021 to 2033 (USD Million)
4.1.5. Immunocompromised
4.1.5.1. Cytomegalovirus
4.1.5.1.1. Cytomegalovirus market estimates and forecast 2021 to 2033 (USD Million)
4.1.5.2. Epstein-Barr virus
4.1.5.2.1. Epstein-Barr virus market estimates and forecast 2021 to 2033 (USD Million)
4.1.5.3. Varicella-Zoster Virus
4.1.5.3.1. Varicella-Zoster Virus market estimates and forecast 2021 to 2033 (USD Million)
4.1.5.4. BK virus
4.1.5.4.1. BK virus market estimates and forecast 2021 to 2033 (USD Million)
4.1.6. Virology
4.1.6.1. Human immunodeficiency viruses
4.1.6.1.1. Human immunodeficiency viruses market estimates and forecast 2021 to 2033 (USD Million)
4.1.6.2. Hepatitis C virus
4.1.6.2.1. Hepatitis C virus market estimates and forecast 2021 to 2033 (USD Million)
4.1.6.3. Hepatitis B virus
4.1.6.3.1. Hepatitis B virus Market Estimates and forecast 2021 to 2033 (USD Million)
4.1.6.4. Hepatitis E virus
4.1.6.4.1. Hepatitis E virus market estimates and forecast 2021 to 2033 (USD Million)
4.1.7. Other Targets
4.1.7.1. Babesia
4.1.7.1.1. Babesia market estimates and forecast 2021 to 2033 (USD Million)
4.1.7.2. Zika
4.1.7.2.1. Zika market estimates and forecast 2021 to 2033 (USD Million)
4.1.7.3. West Nile Virus
4.1.7.3.1. West Nile Virus market estimates and forecast 2021 to 2033 (USD Million)
4.1.7.4. Chikungunya virus/Dengue virus
4.1.7.4.1. Chikungunya virus/Dengue Virus Market Estimates and forecast 2021 to 2033 (USD Million)
4.1.7.5. Enhancer of zeste homolog 2
4.1.7.5.1. Enhancer of zeste homolog 2 market estimates and forecast 2021 to 2033 (USD Million)
4.1.7.6. PIK3CA
4.1.7.6.1. PIK3CA market estimates and forecast 2021 to 2033 (USD Million)
4.1.7.7. Malaria
4.1.7.7.1. Malaria market estimates and forecast 2021 to 2033 (USD Million)
4.1.7.8. Monkeypox Virus
4.1.7.8.1. Monkeypox Virus market estimates and forecast 2021 to 2033 (USD Million)
4.1.8. Other Panels
4.1.8.1. Meningitis Panel
4.1.8.1.1. Meningitis Panel market estimates and forecast 2021 to 2033 (USD Million)
4.1.8.2. Lyme Panel
4.1.8.2.1. Lyme Panel market estimates and forecast 2021 to 2033 (USD Million)
4.1.8.3. UTI Panel
4.1.8.3.1. UTI Panel market estimates and forecast 2021 to 2033 (USD Million)
4.1.9. Oncology
4.1.9.1. Microsatellite Instability
4.1.9.1.1. Microsatellite Instability market estimates and forecast 2021 to 2033 (USD Million)
4.1.9.2. B-raf
4.1.9.2.1. B-raf market estimates and forecast 2021 to 2033 (USD Million)
4.1.9.3. Epidermal Growth Factor Receptor
4.1.9.3.1. Epidermal Growth Factor Receptor market estimates and forecast 2021 to 2033 (USD Million)
4.1.9.4. Kirsten Rat Sarcoma Virus
4.1.9.4.1. Kirsten Rat Sarcoma Virus market estimates and forecast 2021 to 2033 (USD Million)
4.1.9.5. Others
4.1.9.5.1. Others Market Estimates and forecast 2021 to 2033 (USD Million)
Chapter 5. U.S. Molecular Diagnostics Market: End-use Estimates & Trend Analysis
5.1. Market Size & Forecasts and Trend Analyses, 2021 to 2033 for the following
5.1.1. Hospital Core Laboratory
5.1.1.1. Hospital Core Laboratory market estimates and forecast 2021 to 2033 (USD Million)
5.1.2. Hospital Alternative Sites
5.1.2.1. Hospital Alternative Sites market estimates and forecast 2021 to 2033 (USD Million)
5.1.3. Decentralized Test Sites
5.1.3.1. Decentralized Test Site market estimates and forecast 2021 to 2033 (USD Million)
5.1.4. Reference Lab
5.1.4.1. Reference Lab market Estimates and forecast 2021 to 2033 (USD Million)
Chapter 6. Competitive Landscape
6.1. Recent Developments & Impact Analysis, By Key Market Participants
6.2. Company/Competition Categorization
6.3. Vendor Landscape
6.3.1. List of key distributors and channel partners
6.3.2. Key customers
6.3.3. Key Company Market Share Analysis, 2024
6.3.4. Abbott
6.3.4.1. Company overview
6.3.4.2. Financial performance
6.3.4.3. Product benchmarking
6.3.4.4. Strategic initiatives
6.3.5. Siemens Healthcare GmbH
6.3.5.1. Company overview
6.3.5.2. Financial performance
6.3.5.3. Product benchmarking
6.3.5.4. Strategic initiatives
6.3.6. QIAGEN
6.3.6.1. Company overview
6.3.6.2. Financial performance
6.3.6.3. Product benchmarking
6.3.6.4. Strategic initiatives
6.3.7. F. Hoffmann-La Roche Ltd
6.3.7.1. Company overview
6.3.7.2. Financial performance
6.3.7.3. Product benchmarking
6.3.7.4. Strategic initiatives
6.3.8. Quest Diagnostics Incorporated
6.3.8.1. Company overview
6.3.8.2. Financial performance
6.3.8.3. Product benchmarking
6.3.8.4. Strategic initiatives
6.3.9. Danaher
6.3.9.1. Company overview
6.3.9.2. Financial performance
6.3.9.3. Product benchmarking
6.3.9.4. Strategic initiatives
6.3.10. Thermo Fisher Scientific, Inc.
6.3.10.1. Company overview
6.3.10.2. Financial performance
6.3.10.3. Product benchmarking
6.3.10.4. Strategic initiatives
6.3.11. Hologic Inc.
6.3.11.1. Company overview
6.3.11.2. Financial performance
6.3.11.3. Product benchmarking
6.3.11.4. Strategic initiatives
6.3.12. BD
6.3.12.1. Company overview
6.3.12.2. Financial performance
6.3.12.3. Product benchmarking
6.3.12.4. Strategic initiatives
6.3.13. Charles River Laboratories
6.3.13.1. Company overview
6.3.13.2. Financial performance
6.3.13.3. Product benchmarking
6.3.13.4. Strategic initiatives
6.3.14. Bio-Rad Laboratories, Inc.
6.3.14.1. Company overview
6.3.14.2. Financial performance
6.3.14.3. Product benchmarking
6.3.14.4. Strategic initiatives
6.3.15. Illumina, Inc.
6.3.15.1. Company Overview
6.3.15.2. Financial performance
6.3.15.3. Product benchmarking
6.3.15.4. Strategic initiatives
6.3.16. Agilent Technologies, Inc.
6.3.16.1. Company Overview
6.3.16.2. Financial performance
6.3.16.3. Product benchmarking
6.3.16.4. Strategic initiatives