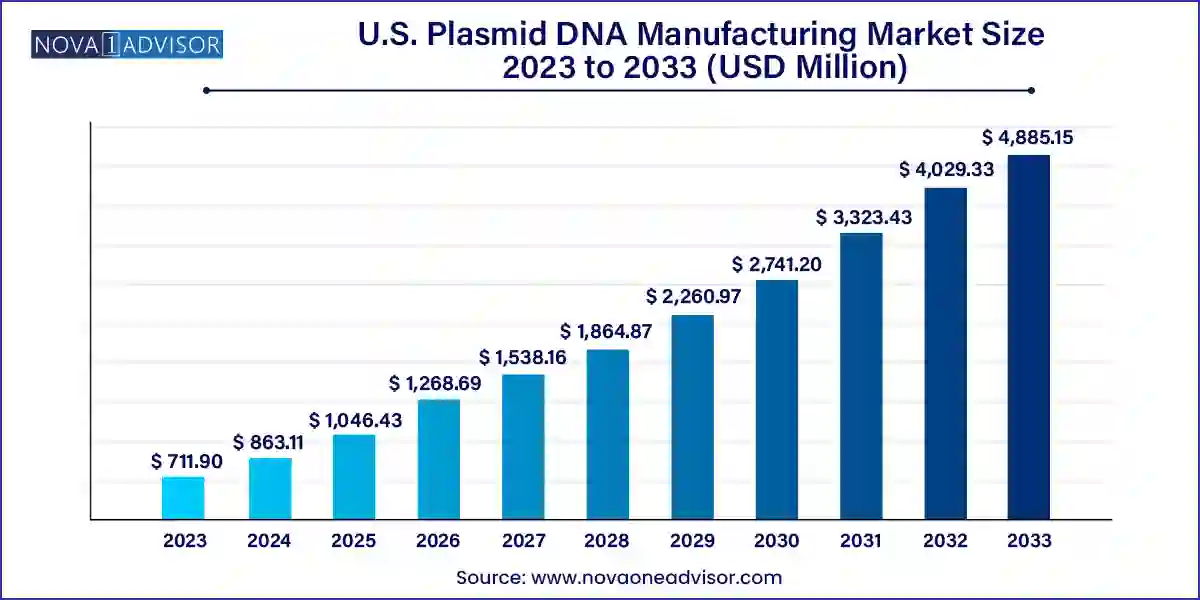
The U.S. plasmid DNA manufacturing market size was valued at USD 711.90 million in 2023 and is projected to surpass around USD 4,885.15 million by 2033, registering a CAGR of 21.24% over the forecast period of 2024 to 2033.

The U.S. plasmid DNA manufacturing market has emerged as a pivotal segment within the larger biopharmaceutical and advanced therapy manufacturing industry. Plasmid DNA (pDNA), a circular, double-stranded DNA molecule commonly used in gene therapy, DNA vaccines, cell therapy, and immunotherapy applications, serves as a fundamental starting material for producing genetic medicines. With the explosive growth of cell and gene therapies, mRNA-based vaccines, and novel immunotherapies, demand for high-quality, scalable, and compliant plasmid DNA manufacturing has soared in the U.S. market.
Unlike traditional pharmaceuticals, modern biologics require specialized molecular components that facilitate the safe and targeted delivery of genetic payloads. Plasmid DNA plays an essential role in upstream biomanufacturing, particularly as a template for viral vector production or as a direct agent in DNA-based vaccines. As the biotechnology pipeline expands, pharmaceutical companies increasingly turn to external manufacturers or build in-house capabilities to meet their plasmid DNA needs across clinical and commercial stages.
The U.S. has established itself as a leader in genetic medicine innovation. Home to leading biopharmaceutical firms, academic research centers, and contract development and manufacturing organizations (CDMOs), the country is experiencing a surge in clinical trials involving gene editing technologies like CRISPR, cancer immunotherapies, and rare disease therapeutics. This scientific momentum is matched by supportive regulatory mechanisms from the FDA and investment initiatives by federal agencies to promote domestic biomanufacturing capacity.
The complexity, cost, and regulatory burden associated with plasmid DNA production at research-grade and GMP levels have made outsourcing an attractive strategy, especially for small-to-mid-size biotech firms. Whether for preclinical development or late-stage commercialization, the market demand for robust plasmid DNA manufacturing is expected to rise sharply over the next decade.
Surge in demand for GMP-grade plasmid DNA, driven by clinical progression and regulatory needs for advanced therapies.
Increased outsourcing to CDMOs by biopharma startups lacking internal manufacturing infrastructure.
Expansion of production capacity in the U.S., supported by public and private investment post-pandemic.
Shift toward synthetic and cell-free DNA manufacturing techniques to overcome traditional scalability challenges.
Growth in DNA vaccine development targeting infectious diseases, cancer, and emerging pathogens.
Integration of digital QA/QC systems and automation in plasmid manufacturing workflows.
Standardization of quality and traceability systems for regulatory compliance in late-stage therapeutics.
Expansion of custom plasmid development services for clients requiring tailor-made constructs and rapid turnaround.
| Report Attribute | Details |
| Market Size in 2024 | USD 863.11 Million |
| Market Size by 2033 | USD 4,885.15 Million |
| Growth Rate From 2024 to 2033 | CAGR of 21.24% |
| Base Year | 2023 |
| Forecast Period | 2024 to 2033 |
| Segments Covered | Grade, development phase, application, disease |
| Market Analysis (Terms Used) | Value (US$ Million/Billion) or (Volume/Units) |
| Report Coverage | Revenue forecast, company ranking, competitive landscape, growth factors, and trends |
| Key Companies Profiled | Charles River Laboratories; VGXI, Inc.; Danaher (Aldevron); Kaneka Corp.; Nature Technology; Cell and Gene Therapy Catapult; Eurofins Genomics; Lonza; Luminous BioSciences, LLC; Akron Biotech |
Cell and gene therapy was the dominating application segment in 2024, given the critical role of plasmid DNA in vector development and cell transfection. Plasmid DNA is indispensable in the upstream production of lentiviral and AAV vectors used in CAR-T therapies, in vivo gene delivery, and other gene-modifying platforms. Companies involved in these therapies must secure a consistent, quality-assured supply of plasmid DNA, making this segment a major demand driver for U.S.-based manufacturers.
DNA vaccines are the fastest-growing application area, particularly following their proven utility during the COVID-19 pandemic. DNA-based vaccines offer several advantages, including stability at room temperature, ease of production, and rapid scalability. Plasmids are used directly in these vaccines to encode antigens and stimulate immune responses. As interest grows in pandemic preparedness and global vaccine equity, DNA vaccine platforms are receiving renewed attention, leading to increasing demand for plasmid DNA manufacturing in this segment.
Cancer dominated the disease segment due to the high volume of oncology programs utilizing plasmid DNA in immunotherapy, gene-modified therapies, and vaccine development. Many CAR-T and TCR therapies use plasmids to insert genetic instructions into patient-derived cells, reprogramming them to target tumors. DNA-based cancer vaccines are also being explored to stimulate patient-specific immune responses. As personalized oncology becomes more mainstream, plasmid DNA will remain central to this innovation frontier.
Genetic disorders represent the fastest-growing disease category, propelled by FDA-approved therapies and promising clinical results. AAV and lentivirus-based gene therapies aimed at treating inherited diseases such as Duchenne muscular dystrophy, hemophilia, and spinal muscular atrophy rely on plasmid DNA for vector generation. The U.S. has become a hub for orphan drug development and rare disease research, and the trend is expected to continue with growing investor interest and policy incentives supporting this sector.
Pre-clinical therapeutics dominated the development phase segment due to the vast number of gene therapy and vaccine candidates currently under investigation. Biopharmaceutical companies and academic labs often begin with R&D-grade plasmid DNA to test efficacy, toxicity, and delivery efficiency. As a majority of pipeline candidates remain in preclinical development, this segment remains a strong contributor to overall market activity, especially in early collaborations between CDMOs and biotech innovators.
Clinical therapeutics are the fastest-growing phase segment, reflecting the growing number of plasmid-dependent drugs entering human trials. Each clinical trial phase requires higher volumes and stricter quality standards for plasmid DNA. CDMOs involved in plasmid manufacturing report increasing batch sizes and stricter quality control requirements for these programs. Additionally, with more FDA-approved Investigational New Drug (IND) applications involving gene-modifying therapeutics, this segment is expected to grow rapidly.
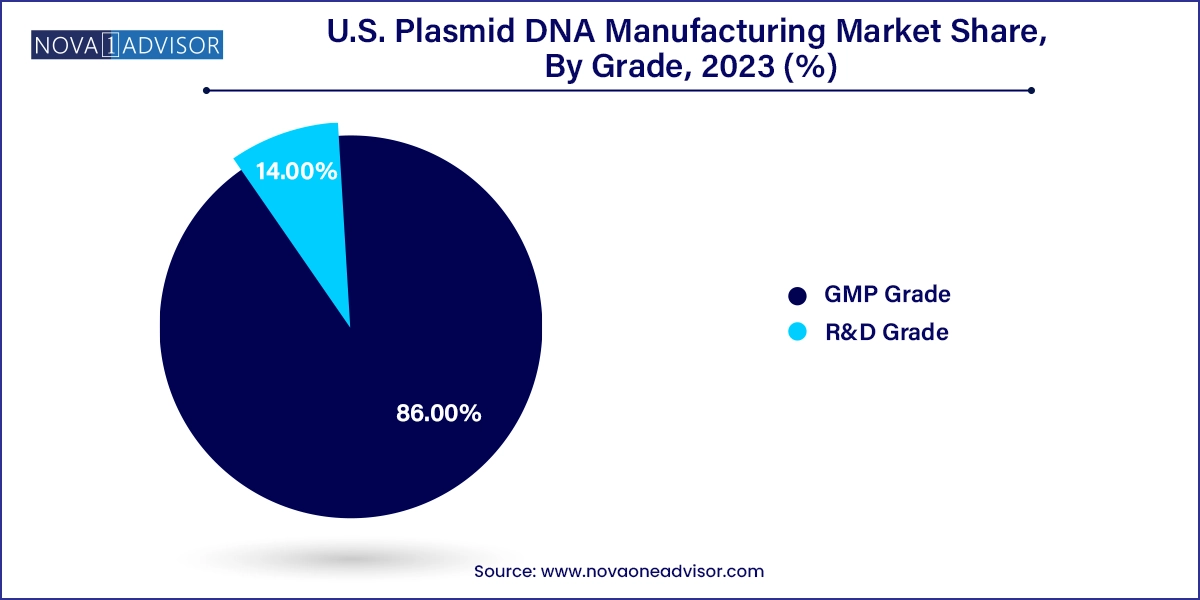
GMP-grade plasmid DNA dominated the U.S. market in 2024, accounting for the majority of revenue due to its use in clinical and commercial biopharmaceuticals. With an increasing number of gene therapies and vaccines progressing into later-stage clinical trials and commercialization, the need for regulatory-grade DNA has become paramount. GMP-grade plasmids must meet strict standards for purity, sterility, and documentation, making their manufacturing both technically and operationally intensive. Pharmaceutical companies are turning to CDMOs with validated GMP suites to ensure compliance and minimize development delays.

R&D-grade plasmids are the fastest-growing segment, driven by increased activity in academic and early-stage biotech research. These plasmids, while not subject to the same regulatory scrutiny as GMP-grade, are crucial for preclinical studies, discovery-phase programs, and proof-of-concept experiments. The relatively lower cost and faster production timeline make them attractive to researchers working under tight budgets and accelerated timelines. The expansion of federal and private research funding in genetic engineering, vaccine research, and synthetic biology further supports the growth of this segment.
The United States leads the global plasmid DNA manufacturing landscape, bolstered by its world-class biotechnology ecosystem, regulatory transparency, and growing public and private investments in advanced therapy manufacturing. Regions such as California, Massachusetts, Maryland, and North Carolina host a dense concentration of biopharma companies, CDMOs, research institutions, and innovation incubators that are propelling the market forward.
The federal government has played a supportive role through initiatives by NIH, BARDA, and the Department of Health and Human Services, which have invested in domestic biomanufacturing infrastructure, especially in response to pandemic-related supply chain vulnerabilities. Furthermore, the FDA’s progressive stance on gene therapy regulation and expedited review pathways for orphan drugs and breakthrough therapies encourage companies to pursue aggressive development timelines that rely on trusted manufacturing partners.
As new modalities such as CRISPR-edited therapies and synthetic biology-based drugs gain traction, U.S.-based CDMOs and biotech firms are investing in facility expansions, automation technologies, and integrated quality systems to remain competitive and resilient in the face of global demand.
March 2025 – Aldevron, a Danaher company, announced a new expansion at its North Carolina facility to triple its GMP plasmid DNA production capacity, addressing the growing demand from commercial gene therapy developers.
February 2025 – Catalent partnered with a U.S.-based gene editing firm to provide end-to-end plasmid DNA manufacturing for clinical programs involving CRISPR-based therapies.
January 2025 – VGXI, Inc. secured a multi-year supply agreement with a leading vaccine developer to manufacture plasmid DNA for a second-generation DNA-based influenza vaccine.
December 2024 – Andelyn Biosciences launched a digital process validation platform to enhance QA and regulatory compliance in GMP-grade plasmid production.
November 2024 – Thermo Fisher Scientific integrated synthetic biology modules into its plasmid design services to accelerate delivery timelines and reduce error rates in construct development.
This report forecasts revenue growth at country levels and provides an analysis of the latest industry trends in each of the sub-segments from 2021 to 2033. For this study, Nova one advisor, Inc. has segmented the U.S. Plasmid DNA Manufacturing market.
By Grade
By Development Phase
By Application
By Disease