U.S. Biosensors Market Size, Share & Trends Analysis Report By Technology (Electrochemical, Thermal, Piezoelectric), By Application (Medical, Food Toxicity, Bioreactor), By End-use, - Industry Analysis, Size, Share, Growth, Trends, and Forecast 2024-2033

U.S. Biosensors Market Size and Research

The U.S. biosensors market size was exhibited at USD 9.85 billion in 2023 and is projected to hit around USD 19.63 billion by 2033, growing at a CAGR of 7.14% during the forecast period 2024 to 2033.
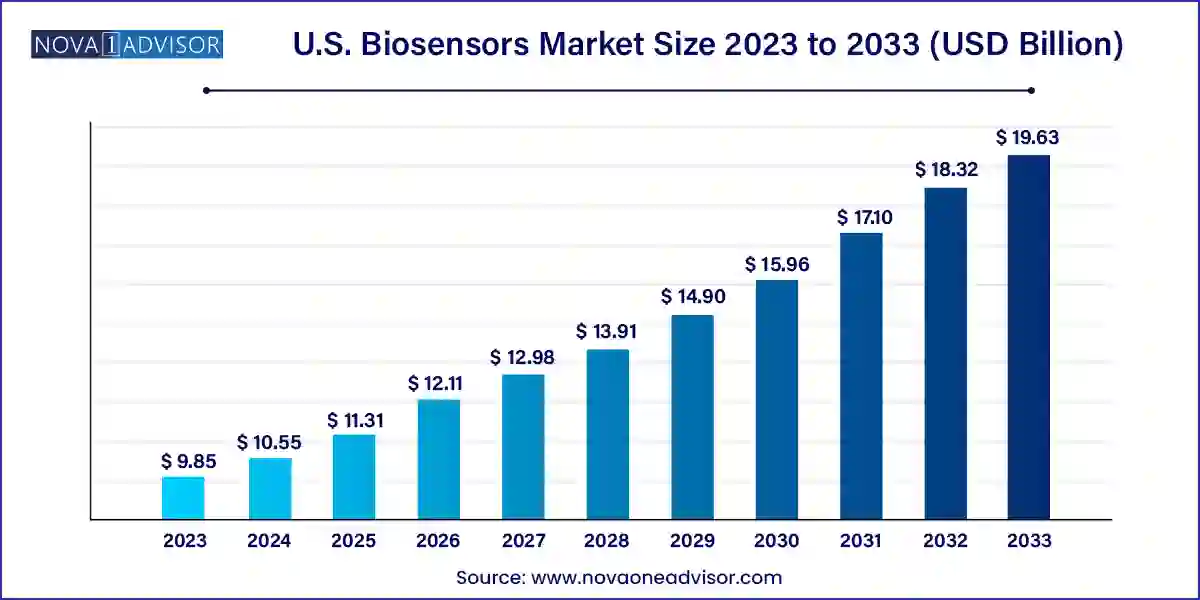
U.S. Biosensors Market Size 2024 To 2033

Key Takeaways:

  • Based on technology, the electrochemical segment led the market with the largest revenue share of 72.95% in 2023.
  • The optical segment is expected to grow at the fastest CAGR during the forecast period.
  • Based on application, the medical segment led the market with the largest revenue share of 67.57% in 2023.
  • The agriculture segment is expected to grow at the fastest CAGR during the forecast period.
  • Based on end-use, the PoC testing segment held the market with the largest revenue share of 47.67% in 2023.
  • The home healthcare diagnostics segment is expected to grow at the fastest CAGR during the forecast period.

The demand for biosensors is increasing due to increasing demand for point-of-care (PoC) testing, technological advancements, rising chronic diseases, focus on personalized medicines, expansion of applications beyond healthcare, and many others. For instance, in April 2021, B.D., a prominent medical technology firm, received emergency use authorization from the U.S. Food and Drug Administration (FDA) for its latest biosensor, engineered to swiftly and precisely identify SARS-CoV-2.

Report Scope of U.S. Biosensors Market

 Report Coverage  Details
Market Size in 2024 USD 10.55 Billion
Market Size by 2033 USD 19.63 Billion
Growth Rate From 2024 to 2033 CAGR of 7.14%
Base Year 2023
Forecast Period 2024-2033
Segments Covered Technology, Application, End-use, Country
Market Analysis (Terms Used) Value (US$ Million/Billion) or (Volume/Units)
Regional Scope U.S.
Key Companies Profiled Abbott; Medtronic; Roche Diagnostics; Dexcom; SENTINEL; Intricon Corporation; Quanterix; Koninklijke Philips N.V.; Masimo; Siemens Healthcare Private Limited; Molecular Devices, LLC.; Johnson & Johnson Services, Inc.; Thermo Fisher Scientific Inc.; PerkinElmer Inc.; Covaris, LLC.

The biosensors market is helping the U.S. to grow in several key aspects, such as healthcare advancements, economic growth, innovation and research, public health and safety, environmental protection, and others. This market is on the verge of significant growth due to technological innovation and environmental sustainability. For instance, in January 2023, Intricon announced the launch of a new Biosensors Center of Excellence (CoE), combining its expertise and capabilities in biosensor devices into a vertically integrated business unit. The CoE is dedicated to delivering biosensor devices to the medical market.

Nanotechnology-based biosensors are revolutionizing industries with their versatility. In healthcare, they enable precise disease diagnosis and personalized treatment. Environmental applications include monitoring air and water quality, detecting pollutants, and ensuring sustainability. Similarly, technological advancements, driven by innovations such as miniaturization and increased sensitivity, alongside the growing prevalence of chronic diseases and emphasis on point-of-care testing, are propelling the global biosensors market forward. According to the U.S. Department of Health and Human Services, in 2023, the U.S. was expected to witness around 2.0 million cancer diagnoses, with breast cancer emerging as the primary diagnosis among women, followed by prostate cancer as the predominant diagnosis among men, amounting to 297,790 and 2,800 cases, respectively. Moreover, bronchus and lung cancer was noted as the third most prevalent cancer diagnosis, with an estimated 238,340 new cases anticipated.

Growing healthcare spending is fueling the market growth in the U.S. According to the Centers for Medicare & Medicaid Services, healthcare spending in the U.S. climbed by 4.1% to USD 4.5 trillion in 2022, surpassing the 3.2% increase in 2021 but lagging behind the significant 10.6% growth seen in 2020. This growth was primarily driven by a substantial rise in Medicaid and private insurance expenditures, although reduced federal COVID-19 relief funds somewhat offset it. Private insurance enrollment saw an uptick of 2.9 million individuals. In contrast, Medicaid enrollment increased by 6.1 million, resulting in a record-high insured population of 92%, with the number of uninsured individuals decreasing from 28.5 million in 2021 to 26.6 million.

The U.S. market is governed by regulatory bodies such as the FDA, ensuring the safety and effectiveness of biosensor products. Businesses within this industry must adhere to regulatory guidelines concerning product approval, quality assurance, and post-market monitoring.

U.S. Biosensors Market By Technology Insights

Based on technology, the electrochemical segment led the market with the largest revenue share of 72.95% in 2023. This is due to the compatibility with various electrode materials and detection mechanisms, allowing for versatile applications across different fields and industries. For instance, the fabrication of custom-designed electrodes for electrochemical biosensors is enabled by 3D printing technology; according to the article published in August 2022 by the National Center for Biotechnology Information (NCBI), 3D printing can potentially improve the performance of electrochemical biosensors for cancer detection in several ways. 3D printing allows for the fabrication of complex sensor designs with high resolution. This enables the creation of sensors that are more sensitive and selective for cancer biomarkers. 3D-printed microfluidic channels can improve the capture of target cells in a sample, enhancing the sensitivity of the biosensor. Moreover, 3D printing allows for the creation of sensors with a wider range of properties.
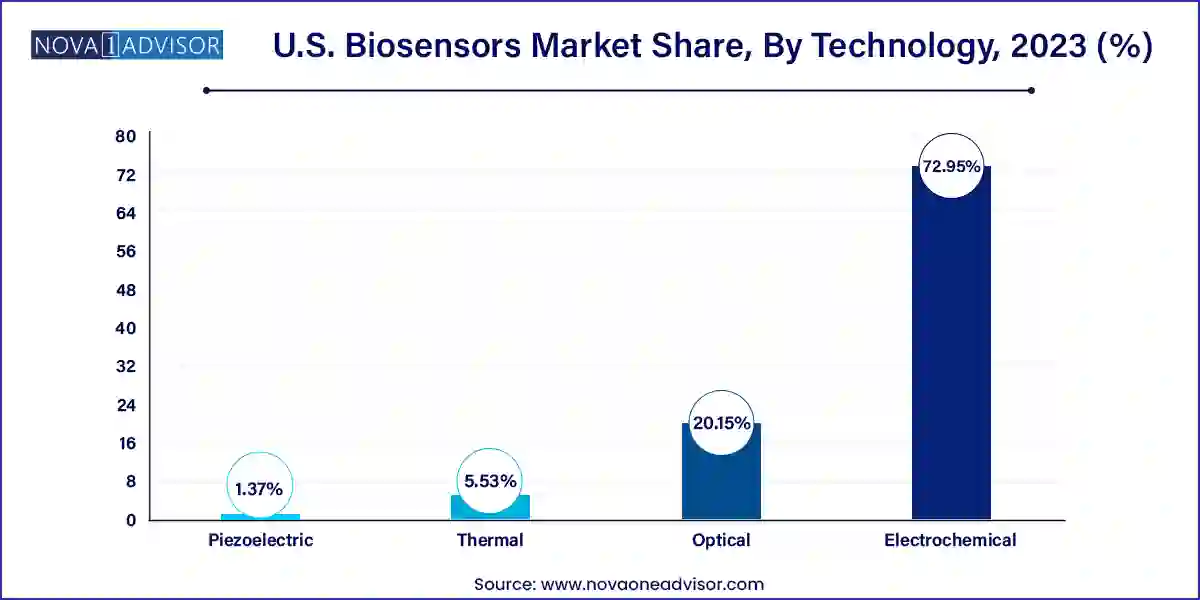
U.S. Biosensors Market Share, By Technology, 2023 (%)

The optical segment is expected to grow at the fastest CAGR during the forecast period. There is an anticipated rise in demand for optical biosensors in analysis due to their extensive analytical capabilities. Optical biosensors enable receptor-cell interactions, fermentation monitoring, structural investigations, concentration assessments, and kinetic and equilibrium studies.

U.S. Biosensors Market By Application Insights

Based on application, the medical segment led the market with the largest revenue share of 67.57% in 2023. The demand for the medical segment has risen due to the increasing prevalence of chronic diseases, advancements in healthcare technology, and the demand for accurate diagnostic tools. For instance, in February 2024, at the European Congress of Radiology (ECR), Koninklijke Philips N.V. announced a new computed tomography (CT) system tailored for the burgeoning cardiac coronary CT angiography (CCTA) market, boasting an innovative detector optimized for artificial intelligence (AI) image reconstruction algorithms. The CT 5300 system promises enhanced accuracy in imaging, addressing the rise in complex cardiac cases, and integrates advanced AI capabilities for diagnosis, interventional procedures, and screening, thereby streamlining workflow efficiency to bolster patient outcomes and departmental productivity amidst growing shortages of radiologists and technologists.

The agriculture segment is expected to grow at the fastest CAGR during the forecast period. There is an increasing demand for food production to meet growing population needs, an emphasis on sustainable agriculture and environmental management, precision farming and crop management, and regulatory requirements for pesticide and fertilizer use. For instance, reducing greenhouse gas emissions is a critical aspect of environmental sustainability, and biosensors came to light as significant tools for observing these emissions in several industries.

U.S. Biosensors Market By End-use Insights

Based on end-use, the PoC testing segment held the market with the largest revenue share of 47.67% in 2023. There are several factors driving PoC testing such as rapid results causing on-the-spot diagnosis and treatment decisions, user-friendly, cost-effective, and market demand. In September 2023, Emergency use authorizations (EUAs) for two distinct point-of-care (POC) assay for SARS-CoV-2 from Tangen Biosciences and SD Biosensor were approved by the U.S. FDA, intended solely for application in CLIA-certified labs capable of conducting various complexity tests, ensuring compliance with regulatory standards and quality control within patient care settings under specified CLIA certificates.

The home healthcare diagnostics segment is expected to grow at the fastest CAGR during the forecast period. This is due to an aging population, increasing chronic diseases, demand for convenient and accessible healthcare solutions, and technological advancements enabling home-based monitoring and diagnostics. According to the Population Reference Bureau, the number of Americans aged 65 and older was estimated to surge from 58 million in 2022 to 82 million by 2050, marking a 47% increase, with the demographic's proportion of the total population expected to climb from 17% to 23%. This demographic shift reflected the aging trend in the U.S., as evidenced by the rise in the median age from 30.0 to 38.9 between 1980 and 2022, with approximately one-third of states recording a median age surpassing 40 in 2022.

Recent Developments

  • In December 2023, PerkinElmer Inc., a prominent provider of analytical services and solutions worldwide, recently acquired Covaris LLC, a key player in developing solutions for advancing life sciences breakthroughs. This acquisition is balanced to enhance Covaris LLC’s growth opportunities and broaden PerkinElmer Inc’s life sciences offerings into the rapidly expanding diagnostics sector
  • In January 2022, Abbott announced the development of a new category of consumer bio wearables named Lingo for keeping track of signals such as ketones, lactate, and glucose in the body to develop a better understanding among people for their health and take necessary actions
  • In September 2021, the Defense Advanced Research Projects Agency (DARPA) of the U.S. Department of Defense introduced a new initiative named the Biological Technologies Office (BTO) to allocate resources towards advancing biosensor technology for diverse applications

Some of the prominent players in the U.S. biosensors market include:

  • Abbott
  • Medtronic
  • F. Hoffmann-La Roche Ltd
  • Dexcom, Inc.
  • SENTINEL
  • Intricon Corporation
  • Quanterix
  • Koninklijke Philips N.V.
  • Masimo
  • Siemens Healthcare Private Limited
  • Molecular Devices, LLC.
  • Johnson & Johnson Services, Inc.
  • Thermo Fisher Scientific Inc.
  • PerkinElmer Inc.
  • Covaris, LLC

Segments Covered in the Report

This report forecasts revenue growth at country levels and provides an analysis of the latest industry trends in each of the sub-segments from 2021 to 2033. For this study, Nova one advisor, Inc. has segmented the U.S. biosensors market

Technology

  • Thermal
  • Electrochemical
  • Piezoelectric
  • Optical

Application

  • Medical
    • Cholesterol
    • Blood Glucose
    • Pregnancy Test
    • Drug Discovery
    • Infectious Disease
  • Food Toxicity
  • Bioreactor
  • Agriculture
  • Environment
  • Others

End-use

  • Home Healthcare Diagnostics
  • PoC Testing
  • Food Industry
  • Research Laboratories
  • Security and Bio-defence

Regional

  • West
  • Midwest
  • Northeast
  • Southwest
  • Southeast

Frequently Asked Questions

The U.S. biosensors market size was valued at USD 9.85 billion in 2023 and is projected to reach USD 10.55 billion in 2024.

The U.S. biosensors market is projected to grow at a compound annual growth rate (CAGR) of 7.14% from 2024 to 2033 to reach USD 19.63 billion by 2033.

Some of the key companies operating in the market include Abbott, Medtronic, Roche Diagnostics, Dexcom, and SENTINEL, among others.

The demand for biosensors is increasing due to increasing demand for point-of-care (PoC) testing, technological advancements, rising chronic diseases, focus on personalized medicines, expansion of applications beyond healthcare, and many others.

Chapter 1. Methodology and Scope

1.1. Market Segmentation & Scope

1.2. Segment Definitions

1.2.1. Technology

1.2.2. Application

1.2.3. End-use

1.2.4. Estimates and forecasts timeline

1.3. Research Methodology

1.4. Information Procurement

1.4.1. Purchased database

1.4.2. internal database

1.4.3. Secondary sources

1.4.4. Primary research

1.5. Information or Data Analysis

1.5.1. Data analysis models

1.6. Market Formulation & Validation

1.7. Model Details

1.7.1. Commodity flow analysis (Model 1)

1.7.2. Volume price analysis (Model 2)

1.8. List of Secondary Sources

1.9. List of Primary Sources

1.10. Objectives

Chapter 2. Executive Summary

2.1. Market Outlook

2.2. Segment Outlook

2.2.1. Technology outlook

2.2.2. Application outlook

2.2.3. End-use outlook

2.3. Competitive Insights

Chapter 3. U.S. Biosensors Market Variables, Trends & Scope

3.1. Market Lineage Outlook

3.1.1. Parent market outlook

3.1.2. Related/ancillary market outlook

3.2. Market Dynamics

3.2.1. Market driver analysis

3.2.2. Market restraint analysis

3.3. U.S. Biosensors Market Analysis Tools

3.3.1. Industry Analysis - Porter’s

3.3.1.1. Supplier power

3.3.1.2. Buyer power

3.3.1.3. Substitution threat

3.3.1.4. Threat of new entrant

3.3.1.5. Competitive rivalry

3.3.2. PESTEL Analysis

3.3.2.1. Political landscape

3.3.2.2. Technological landscape

3.3.2.3. Economic landscape

3.3.2.4. Social landscape

3.3.2.5. Legal landscape

3.3.2.6. Environmental landscape

Chapter 4. U.S. Biosensors Market: Technology Estimates & Trend Analysis

4.1. Technology Market Share, 2024 & 2033

4.2. Segment Dashboard

4.3. U.S. biosensors market By Technology Outlook

4.4. Market Size & Forecasts and Trend Analyses, 2021 to 2033 for the following

4.4.1. Thermal

4.4.1.1. Market estimates and forecasts 2021 to 2033

4.4.2. Electrochemical

4.4.2.1. Market estimates and forecasts 2021 to 2033

4.4.3. Piezoelectric

4.4.3.1. Market estimates and forecasts 2021 to 2033

4.4.4. Optical

4.4.4.1. Market estimates and forecasts 2021 to 2033

Chapter 5. U.S. Biosensors Market: Application Estimates & Trend Analysis

5.1. Product Market Share, 2024 & 2033

5.2. Segment Dashboard

5.3. U.S. biosensors market By Application Outlook

5.4. Market Size & Forecasts and Trend Analyses, 2021 to 2033 for the following

5.4.1. Medical

5.4.1.1. Market estimates and forecasts 2021 to 2033

5.4.2. Food Toxicity

5.4.2.1. Market estimates and forecasts 2021 to 2033

5.4.3. Bioreactor

5.4.3.1. Market estimates and forecasts 2021 to 2033

5.4.4. Agriculture

5.4.4.1. Market estimates and forecasts 2021 to 2033

5.4.5. Environment

5.4.5.1. Market estimates and forecasts 2021 to 2033

5.4.6. Others

5.4.6.1. Market estimates and forecasts 2021 to 2033

Chapter 6. U.S. Biosensors Market: End-use Estimates & Trend Analysis

6.1. End-use Market Share, 2024 & 2033

6.2. Segment Dashboard

6.3. U.S. Biosensors Market By End-use Outlook

6.4. Market Size & Forecasts and Trend Analyses, 2021 to 2033 for the following

6.4.1. Home healthcare diagnostics

6.4.1.1. Market estimates and forecasts 2021 to 2033

6.4.2. PoC testing

6.4.2.1. Market estimates and forecasts 2021 to 2033

6.4.3. Food industry

6.4.3.1. Market estimates and forecasts 2021 to 2033

6.4.4. Research Laboratories

6.4.4.1. Market estimates and forecasts 2021 to 2033

6.4.5. Security and Bio-defense

6.4.5.1. Market estimates and forecasts 2021 to 2033

Chapter 7. U.S. Biosensors Market: Region Estimates & Trend Analysis

7.1. Regional Market Share, 2024 & 2033

7.2. U.S. Biosensors Market by Region Outlook

7.3. Market Size & Forecasts and Trend Analyses, 2021 to 2033 for the Following

7.3.1. West

7.3.1.1. Market estimates and forecasts 2021 to 2033

7.3.2. Midwest

7.3.2.1. Market estimates and forecasts 2021 to 2033

7.3.3. Northeast

7.3.3.1. Market estimates and forecasts 2021 to 2033

7.3.4. Southwest

7.3.4.1. Market estimates and forecasts 2021 to 2033

7.3.5. Southeast

7.3.5.1. Market estimates and forecasts 2021 to 2033

Chapter 8. Competitive Landscape

8.1. Recent Developments & Impact Analysis, By Key Market Participants

8.2. Company/Competition Categorization

8.3. Vendor Landscape

8.3.1. List of key distributors and channel partners

8.3.2. Key customers

8.3.3. Key company heat map analysis, 2023

8.4. Company Profiles

8.4.1. Abbott

8.4.1.1. Company overview

8.4.1.2. Financial performance

8.4.1.3. Product benchmarking

8.4.1.4. Strategic initiatives

8.4.2. Medtronic

8.4.2.1. Company overview

8.4.2.2. Financial performance

8.4.2.3. Product benchmarking

8.4.2.4. Strategic initiatives

8.4.3. Hoffmann-La Roche Ltd

8.4.3.1. Company overview

8.4.3.2. Financial performance

8.4.3.3. Product benchmarking

8.4.3.4. Strategic initiatives

8.4.4. Dexcom, Inc.

8.4.4.1. Company overview

8.4.4.2. Financial performance

8.4.4.3. Product benchmarking

8.4.4.4. Strategic initiatives

8.4.5. SENTINEL

8.4.5.1. Company overview

8.4.5.2. Financial performance

8.4.5.3. Product benchmarking

8.4.5.4. Strategic initiatives

8.4.6. Intricon Corporation

8.4.6.1. Company overview

8.4.6.2. Financial performance

8.4.6.3. Product benchmarking

8.4.6.4. Strategic initiatives

8.4.7. Quanterix

8.4.7.1. Company overview

8.4.7.2. Financial performance

8.4.7.3. Product benchmarking

8.4.7.4. Strategic initiatives

8.4.8. Koninklijke Philips N.V.

8.4.8.1. Company overview

8.4.8.2. Financial performance

8.4.8.3. Product benchmarking

8.4.8.4. Strategic initiatives

8.4.9. Masimo

8.4.9.1. Company overview

8.4.9.2. Financial performance

8.4.9.3. Product benchmarking

8.4.9.4. Strategic initiatives

8.4.10. Siemens Healthcare Private Limited

8.4.10.1. Company overview

8.4.10.2. Financial performance

8.4.10.3. Product benchmarking

8.4.10.4. Strategic initiatives

8.4.11. Molecular Devices, LLC.

8.4.11.1. Company overview

8.4.11.2. Financial performance

8.4.11.3. Product benchmarking

8.4.11.4. Strategic initiatives

8.4.12. Johnson & Johnson Services, Inc.

8.4.12.1. Company overview

8.4.12.2. Financial performance

8.4.12.3. Product benchmarking

8.4.12.4. Strategic initiatives

8.4.13. Thermo Fisher Scientific Inc.

8.4.13.1. Company overview

8.4.13.2. Financial performance

8.4.13.3. Product benchmarking

8.4.13.4. Strategic initiatives

8.4.14. PerkinElmer Inc.

8.4.14.1. Company overview

8.4.14.2. Financial performance

8.4.14.3. Product benchmarking

8.4.14.4. Strategic initiatives

8.4.15. Covaris, LLC

8.4.15.1. Company overview

8.4.15.2. Financial performance

8.4.15.3. Product benchmarking


8.4.15.4. Strategic initiatives

Proceed To Buy

USD 3800
USD 1900
USD 1200

Customization Offered

  • check-img Cross-segment Market Size and Analysis for Mentioned Segments
  • check-imgAdditional Company Profiles (Upto 5 With No Cost)
  • check-img Additional Countries (Apart From Mentioned Countries)
  • check-img Country/Region-specific Report
  • check-img Go To Market Strategy
  • check-imgRegion Specific Market Dynamics
  • check-imgRegion Level Market Share
  • check-img Import Export Analysis
  • check-imgProduction Analysis
  • check-imgOthers