The U.S. high potency active pharmaceutical ingredients market size was valued at USD 6.95 billion in 2023 and is projected to surpass around USD 16.74 billion by 2033, registering a CAGR of 9.19% over the forecast period of 2024 to 2033.
.webp)
The high potency active pharmaceutical ingredients (HPAPI) are more effective than conventional APIs at considerably lower dosage levels, but their handling issues are unique due to their potency. One significant reason anticipated to propel the market for highly potent active pharmaceutical ingredients is the increased incidence of cancer (HPAPIs). The WHO estimates that cancer is the second leading cause of mortality, accounting for nearly 9.6 million deaths in 2019, with tobacco use accounting for 22% of those deaths. The entire burden of the disease has been attributed, according to the CDC, to risk factors including lifestyle modifications like smoking, obesity, drinking alcohol, and exposure to UV radiation from the sun or tanning beds. Furthermore, it is predicted that the cost of cancer treatment will rise to USD 174 billion by the end of 2022, which will likely drive market expansion.
The U.S. High Potency Active Pharmaceutical Ingredients (HPAPI) market is experiencing significant growth driven by several key factors. Increasing prevalence of chronic diseases such as cancer, cardiovascular conditions, and autoimmune disorders is fueling the demand for potent medications that require HPAPIs. Additionally, advancements in biopharmaceutical technology and the growing trend of targeted therapy are boosting the development and adoption of HPAPIs. Stringent regulatory standards and the necessity for specialized manufacturing facilities are also propelling market expansion as pharmaceutical companies invest in state-of-the-art technologies to meet compliance and safety requirements. Furthermore, strategic collaborations and partnerships among key industry players are enhancing research and development capabilities, further driving innovation and growth in the HPAPI sector.
| Report Attribute | Details |
| Market Size in 2024 | USD 7.59 Billion |
| Market Size by 2033 | USD 16.74 Billion |
| Growth Rate From 2024 to 2033 | CAGR of 9.19% |
| Base Year | 2023 |
| Forecast Period | 2024 to 2033 |
| Segments Covered | By Product, By Manufacturer Type, By Drug Type, and By Application |
| Market Analysis (Terms Used) | Value (US$ Million/Billion) or (Volume/Units) |
| Report Coverage | Revenue forecast, company ranking, competitive landscape, growth factors, and trends |
| Key Companies Profiled | BASF SE, CordenPharma, Dr. Reddy’s Laboratories Ltd., CARBOGEN AMCIS AG, Pfizer, Inc., Sun Pharmaceutical Industries, Ltd., Teva Pharmaceutical Industries Ltd., Albany Molecular Research, Inc., Sanofi S.A., Merck & Co., Inc., Novartis AG |
In the U.S. high potency active pharmaceutical ingredients market, the in-house segment predominates among manufacturers. Pharmaceutical companies prioritize in-house production to maintain control over quality, intellectual property, and regulatory compliance. This approach allows for tighter integration with drug development processes, facilitating agility and customization to meet specific requirements. Furthermore, in-house manufacturing provides a competitive edge through cost efficiencies and proprietary technologies. While contract manufacturing organizations (CMOs) play a significant role in the market, especially for smaller companies or niche products, the dominance of in-house production underscores the strategic advantages and control sought by pharmaceutical manufacturers in the U.S.
In the U.S. high potency active pharmaceutical ingredients market, the oncology segment emerges as a dominant force, driving significant growth and innovation. With advancements in cancer treatment, there’s a heightened demand for potent APIs tailored to oncology therapies. These APIs are crucial for formulating effective cancer drugs with precise targeting and minimal side effects. The oncology segment’s dominance underscores the prioritization of cancer research and development within the pharmaceutical industry. Companies specializing in high potency APIs for oncology applications capitalize on this trend, contributing to the market’s expansion and pushing the boundaries of cancer treatment in the United States.
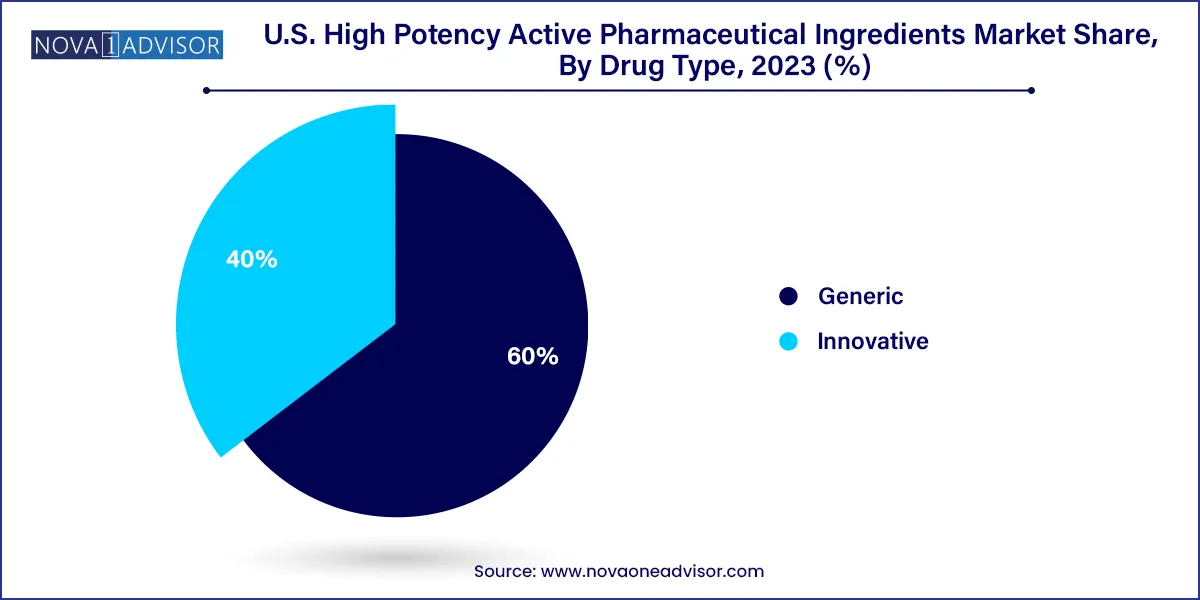
In the U.S. high potency active pharmaceutical ingredients market, the innovative drugs segment holds dominance, driving significant growth and innovation. This segment encompasses novel therapies and cutting-edge pharmaceutical products developed by biopharmaceutical companies and research institutions. These innovative drugs often target complex diseases and conditions, offering improved efficacy and patient outcomes. Factors such as substantial investments in research and development, advancements in biotechnology, and regulatory support contribute to the prominence of this segment. With a focus on breakthrough treatments and therapies, the innovative drugs segment continues to shape the landscape of the U.S. high potency active pharmaceutical ingredients market.

In the U.S. high potency active pharmaceutical ingredients market, the synthetic segment emerges as the dominant force by product type. Synthetic APIs, often manufactured through chemical synthesis, hold a substantial share due to their versatility, scalability, and cost-effectiveness. They cater to a wide range of therapeutic areas, including oncology, central nervous system disorders, and autoimmune diseases. The synthetic segment’s dominance is further fueled by advancements in chemical processes, enabling the production of complex molecules with high potency and purity. This underscores the significance of synthetic APIs in meeting the demand for innovative pharmaceutical products and driving growth within the U.S. high potency active pharmaceutical ingredients market.
This report forecasts revenue growth at country levels and provides an analysis of the latest industry trends in each of the sub-segments from 2021 to 2033. For this study, Nova one advisor, Inc. has segmented the U.S. High Potency Active Pharmaceutical Ingredients market.
By Product
By Manufacturer Type
By Drug Type
By Application